Candlestick and Chart Patterns: The Complete List
Every pattern gets the same treatment: an annotated example chart drawn to the textbook definition, an identification checklist, how it is traded, what invalidates it, and an honest note on what the evidence supports, including where it does not support much.
Bullish reversal candlestick patterns
They form after a decline and hint that buyers are taking over. None is a signal on its own: each needs confirmation.
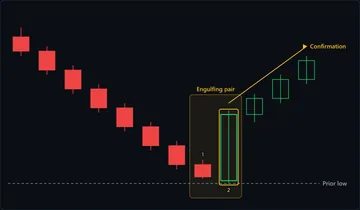
Bullish Engulfing
A bullish engulfing pattern is a two-candle formation in which a small down candle is followed by a larger up candle whose body completely engulfs the first, signalling that buyers have taken control after a decline.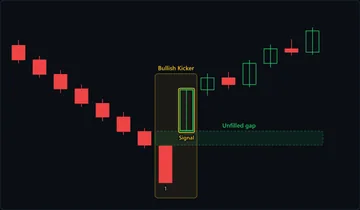
Bullish Kicker
A bullish kicker is a two-candle reversal in which a long red candle with almost no wicks is followed by a long green candle that opens above the red candle's open and closes at its high, leaving a gap between the two bodies that stays unfilled.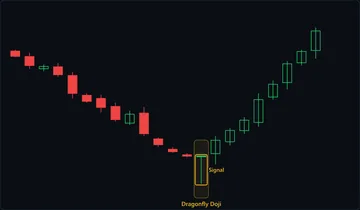
Dragonfly Doji
A dragonfly doji is a single T-shaped candlestick whose open, high and close sit at virtually the same price above a long lower wick: sellers drove price well down during the session, buyers bought it all back by the close, and after a decline it marks a possible bullish reversal.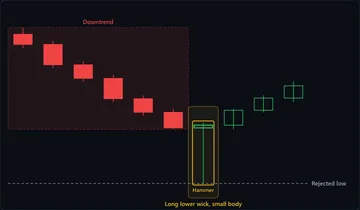
Hammer
A hammer is a single candlestick with a long lower wick and a small body near the top of its range, forming after a decline: sellers drove price sharply down during the session and buyers recovered almost all of it before the close.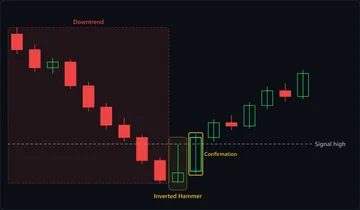
Inverted Hammer
An inverted hammer is a single candlestick that forms after a decline, with a small body at the bottom of its range and a long upper wick: buyers pushed price well above the open during the session but could not hold it, so the close lands near the low.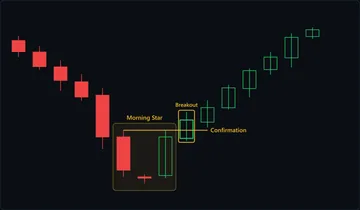
Morning Star
A morning star is a three-candle bullish reversal pattern: a long bearish candle, followed by a small-bodied candle that gaps lower, followed by a long bullish candle that closes well back up into the first candle's body.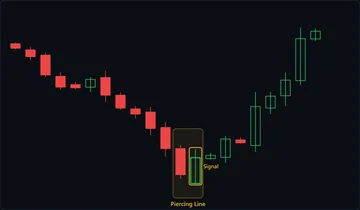
Piercing Line
A piercing line is a two-candle bullish reversal in a downtrend: a long red candle is followed by a green candle that opens below the red candle's low and closes above the midpoint of its body but below its open.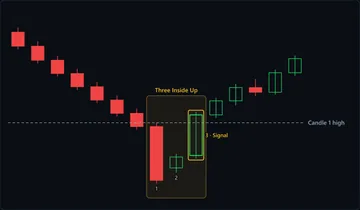
Three Inside Up
A three inside up is a three-candle bullish reversal after a decline: a long red candle, a small green candle whose body sits inside the red body (a bullish harami), then a green candle that closes above the first candle's open, taking back the entire red body.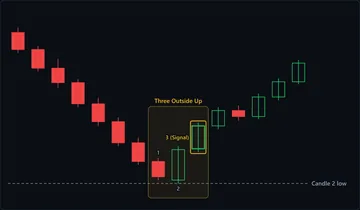
Three Outside Up
A three outside up is a three-candle bullish reversal in which a large green candle engulfs a small red candle at the end of a decline, and a third green candle then closes above the engulfing candle's close, showing buyers kept control for a second session.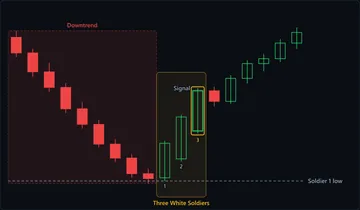
Three White Soldiers
Three white soldiers is a bullish three-candle pattern of consecutive long green candles, each opening inside the previous candle's body and closing at or near its high, that appears after a decline or a base and shows buyers in control session after session.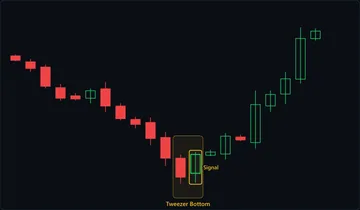
Tweezer Bottom
A tweezer bottom is a two-candle bullish reversal signal that forms after a decline when a red candle and the green candle after it bottom out at the same or nearly the same price, showing that sellers were stopped at one level twice in a row.Bearish reversal candlestick patterns
They form after an advance and hint that sellers are taking over. Wait for confirmation before acting on any of them.
Bearish Engulfing
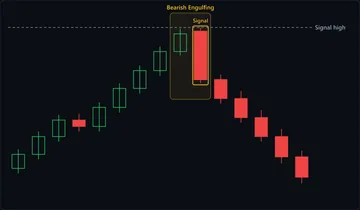
A bearish engulfing is a two-candle reversal pattern at the top of a rally: a green candle is followed by a larger red candle that opens at or above the green close and closes below the green open, so the red body completely covers the green one.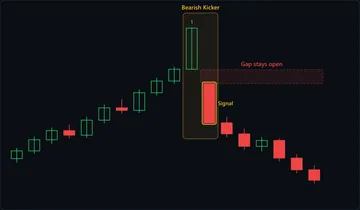
Bearish Kicker
A bearish kicker is a two-candle pattern in which a strong green candle with almost no wicks is followed by a gap down into a red marubozu that opens below the first candle's open and closes at its low, flipping control from buyers to sellers with no overlap between the two bodies.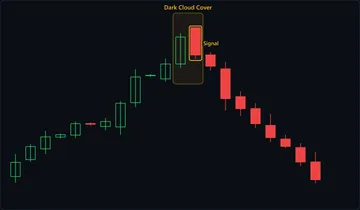
Dark Cloud Cover
A dark cloud cover is a two-candle bearish reversal pattern at the top of an advance: after a long green candle, a red candle opens above the green candle's high, then closes below the midpoint of the green body but still above the green candle's open.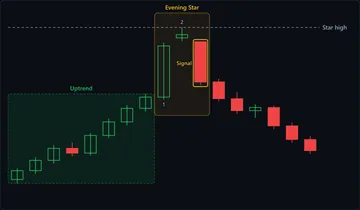
Evening Star
An evening star is a three-candle bearish reversal at the top of an advance: a long green candle, a small-bodied candle that stalls above it, and a long red candle that closes at least halfway down the first candle's body.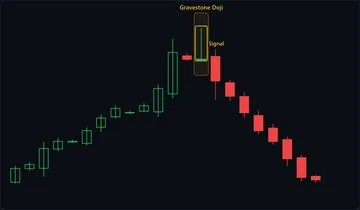
Gravestone Doji
A gravestone doji is a candle shaped like an upside-down T, a long upper wick over open, low and close bunched at the bottom: buyers rallied during the session and sellers erased the gain by the close, so when it caps an advance it warns the rally may be failing.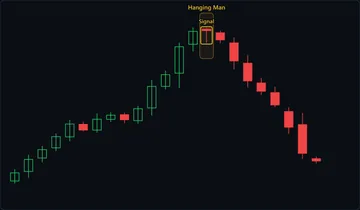
Hanging Man
A hanging man is a single-candle bearish warning that forms after an advance: a small body near the top of the range, a lower wick at least twice the body's height and little or no upper wick, showing sellers drove price sharply lower mid-session before buyers hauled it back.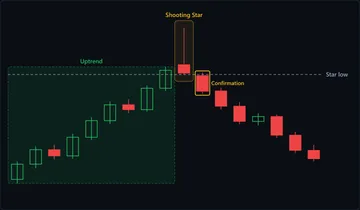
Shooting Star
A shooting star is a single candlestick with a long upper wick and a small body near the bottom of its range, forming after an advance: buyers drove price sharply higher during the session and sellers took back almost all of the gain before the close.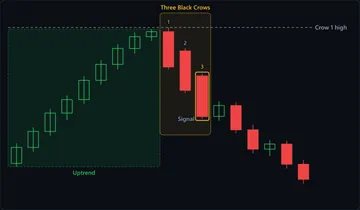
Three Black Crows
Three black crows is a bearish reversal pattern of three consecutive long red candles after an advance, each opening inside the previous candle's body and closing at or near its low, showing sellers in control from open to close for three straight sessions.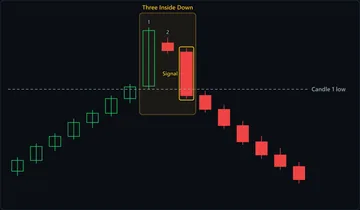
Three Inside Down
A three inside down is a three-candle bearish reversal at the top of a rally: a long green candle, a small red candle whose body fits inside it, then a red candle that closes below the first candle's open, undoing that candle's entire gain.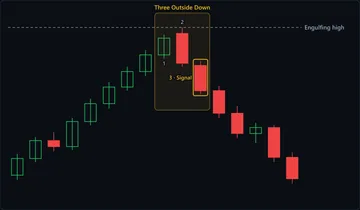
Three Outside Down
A three outside down is a three-candle bearish reversal in which a large red candle engulfs a smaller green candle at the end of a rally, and a third red candle then closes below the engulfing candle's close, showing sellers held control for a second session.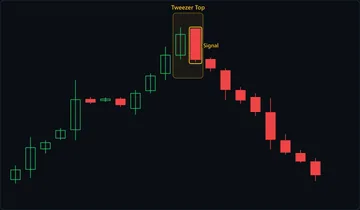
Tweezer Top
A tweezer top is a two-candle bearish reversal signal in which consecutive candles after a rally print matching or near-matching highs, usually a green candle followed by a red one, showing buyers rejected at the same price twice in a row.Indecision candlestick patterns
Neither side is in control. These mean something only in context: at a key level, or after a strong move.
Doji
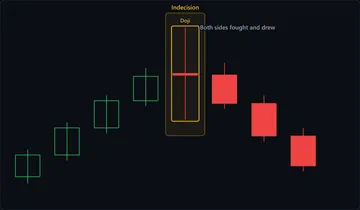
A doji is a single candlestick whose open and close are virtually identical, leaving a tiny or non-existent body. It represents indecision: buyers and sellers fought through the session and finished level, so the direction that follows depends entirely on context.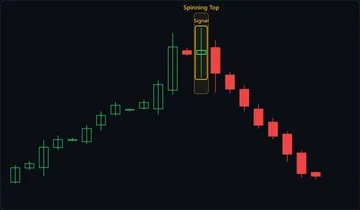
Spinning Top
A spinning top is a single candle with a small real body and upper and lower wicks of similar length, showing that buyers and sellers each pushed price away from the open during the session and both were pulled back, so the trend's drive is hesitating.Bullish reversal chart patterns
They form after a decline and hint that buyers are taking over. None is a signal on its own: each needs confirmation.
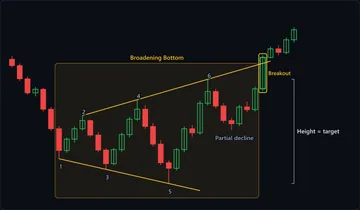
Broadening Bottom
A broadening bottom is a bullish reversal pattern that forms after a decline, in which price swings make lower lows and higher highs between a falling lower trendline and a rising upper one, a widening megaphone that is read as bullish once a sell-off stops short of the lower line and price closes above the upper one.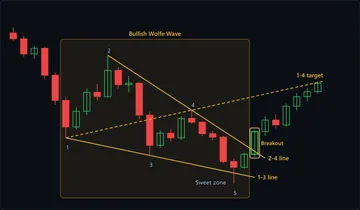
Bullish Wolfe Wave
A bullish Wolfe wave is a five-point reversal pattern inside a falling wedge: the fifth wave dips briefly below the line through points 1 and 3, then turns up, and the target is a rising line drawn from point 1 through point 4.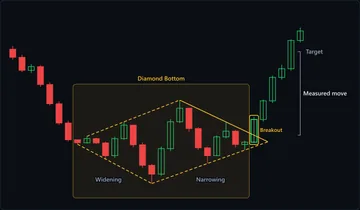
Diamond Bottom
A diamond bottom is a bullish reversal pattern that forms after a decline: price swings first widen into lower lows and higher highs, then narrow into higher lows and lower highs, and the pattern completes when price closes above the upper-right boundary.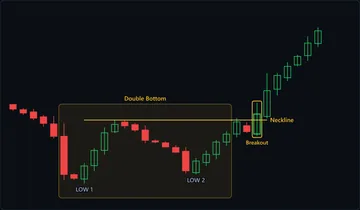
Double Bottom
A double bottom is a bullish reversal pattern made of two lows at roughly the same price, separated by a clear rally. It completes when price closes above the neckline drawn through the high between the two lows.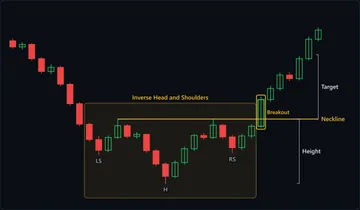
Inverse Head and Shoulders
An inverse head and shoulders is a bullish reversal pattern that forms after a downtrend: three troughs, with the middle one (the head) the lowest, and a neckline across the two rally highs between them that price must close above to confirm the bottom.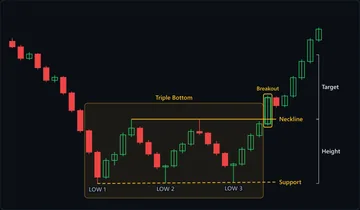
Triple Bottom
A triple bottom is a bullish reversal chart pattern in which a downtrend makes three lows at roughly the same price, separated by two rallies, and is confirmed only when price closes above the resistance line drawn through those rally highs.Bearish reversal chart patterns
They form after an advance and hint that sellers are taking over. Wait for confirmation before acting on any of them.
Bearish Wolfe Wave
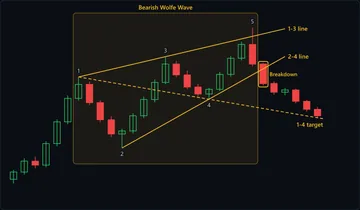
A bearish Wolfe wave is a five-point rising wedge in which the fifth wave pushes briefly above the line through points 1 and 3, fails, and reverses toward a target line drawn from point 1 through point 4.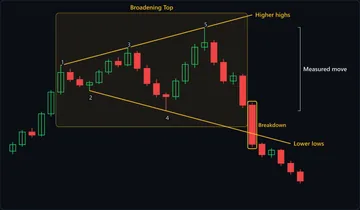
Broadening Top
A broadening top is a bearish reversal chart pattern that forms after an uptrend, in which price swings between a rising upper trendline and a falling lower trendline, making higher highs and lower lows until a close below the lower line ends the advance.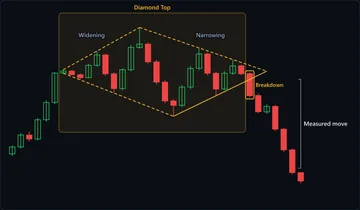
Diamond Top
A diamond top is a bearish reversal pattern that forms after an advance: price swings first widen into higher highs and lower lows, then narrow into lower highs and higher lows, and a close below the lower-right edge confirms the turn.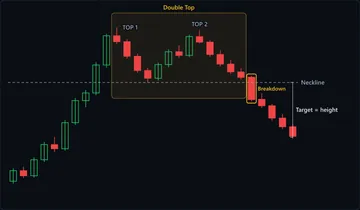
Double Top
A double top is a bearish reversal pattern made of two peaks at roughly the same price, separated by a meaningful pullback. It completes when price closes below the neckline drawn through the low between the two peaks.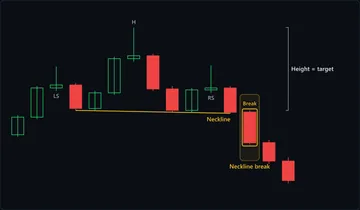
Head and Shoulders
A head and shoulders is a bearish reversal pattern made of three peaks: a left shoulder, a higher head, and a right shoulder roughly level with the left. It completes when price closes below the neckline drawn through the two lows between the peaks.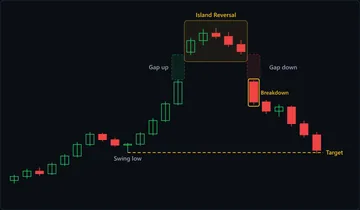
Island Reversal
An island reversal is a cluster of one or more candles cut off by a gap on each side: price gaps in the trend's direction, trades in a small isolated range, then gaps back the other way, leaving the island stranded and the trend reversed.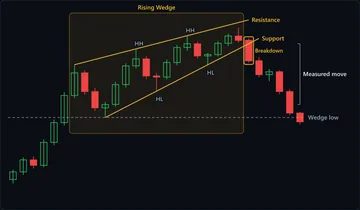
Rising Wedge
A rising wedge is a bearish chart pattern in which price makes higher highs and higher lows between two upward-sloping trendlines that converge, because the lows rise faster than the highs. It is confirmed when price closes below the lower line.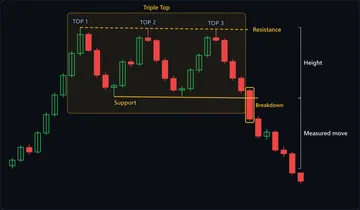
Triple Top
A triple top is a bearish reversal pattern in which price rallies to roughly the same high three times after an uptrend, fails each time, and completes only when it closes below the support formed by the two troughs between those peaks.Continuation chart patterns
Pauses inside a trend that traders expect to resolve in the direction of that trend. Plenty do not, which is what the stop is for.
Ascending Channel
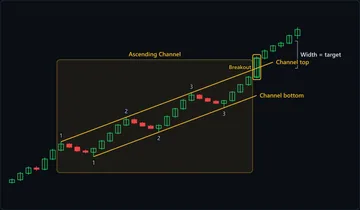
An ascending channel is an uptrend contained between two parallel rising trendlines: a lower line through the higher lows and an upper line through the higher highs, with price swinging between them until one side gives way.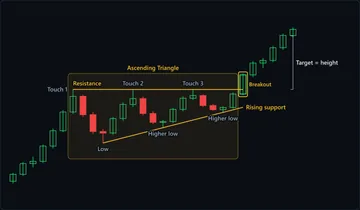
Ascending Triangle
An ascending triangle is a continuation pattern formed by a flat line of resistance capping a series of progressively higher lows. Buyers keep paying more each time price pulls back, and the pattern typically resolves with a breakout above the flat resistance.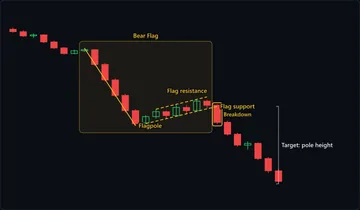
Bear Flag
A bear flag is a bearish continuation pattern in which a steep sell-off, the pole, is followed by a brief, narrow bounce drifting up or sideways between parallel lines, and a close below the bounce's lower line signals the decline resuming.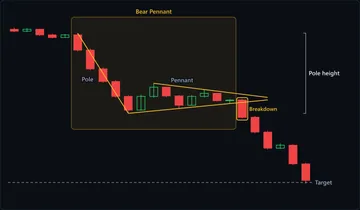
Bear Pennant
A bear pennant is a bearish continuation pattern in which a steep decline, the pole, is followed by a brief, small consolidation between converging trendlines, before price closes below the lower line and the sell-off resumes.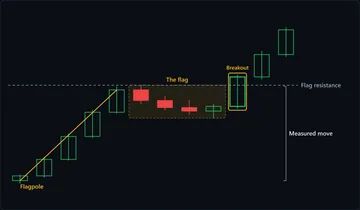
Bull Flag
A bull flag is a continuation pattern in which a sharp advance — the flagpole — is followed by a shallow, orderly consolidation that drifts sideways or slightly lower, before price breaks out and resumes the original direction.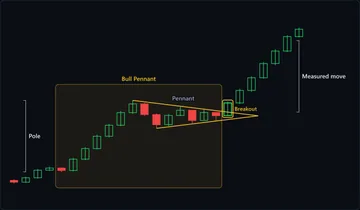
Bull Pennant
A bull pennant is a bullish continuation pattern in two parts: a sharp rally, called the pole, and the small, short-lived symmetrical triangle of lower highs and higher lows that follows it; a close above the triangle's upper line is read as the rally resuming.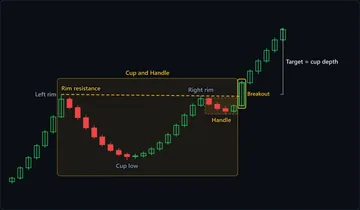
Cup and Handle
A cup and handle is a bullish continuation pattern: a broad, U-shaped decline and recovery (the cup) back to roughly its starting price, followed by a shallow pullback just under that level (the handle), before price breaks out above the rim.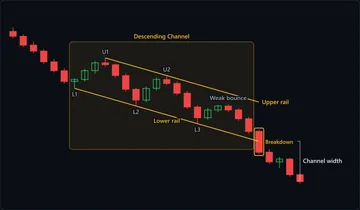
Descending Channel
A descending channel is a downtrend contained between two parallel falling lines: an upper rail joining successive lower highs and a lower rail joining successive lower lows, with price swinging between them until a close beyond one rail ends the structure.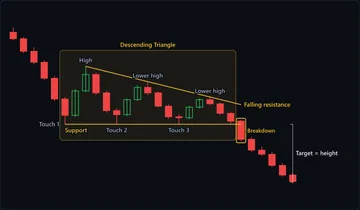
Descending Triangle
A descending triangle is a bearish chart pattern in which price keeps bouncing off a flat support level while each rally peaks lower, squeezing the range against that floor until a close below support shows the buyers defending it have given way.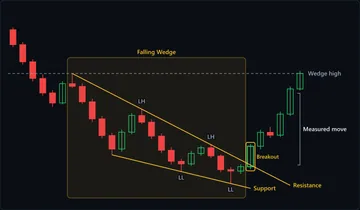
Falling Wedge
A falling wedge is a bullish chart pattern in which price makes lower highs and lower lows between two downward-sloping trendlines that converge, because the highs fall faster than the lows, until price closes above the upper line.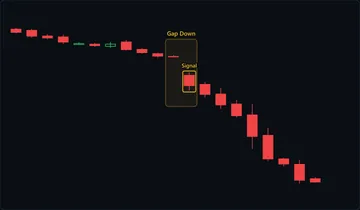
Gap Down
A gap down is a break in the chart where a candle's high stays below the previous candle's low, so a band of prices goes untraded overhead, usually because bad news or heavy selling while the market was closed repriced it at the open.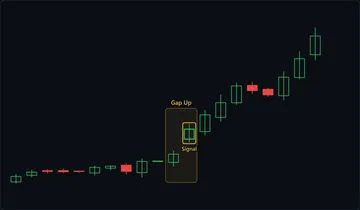
Gap Up
A gap up is an upward price gap in which a candle trades entirely above the previous candle's high, leaving an empty band on the chart that no candle touches — usually because news or a wave of overnight buying repriced the market before the open.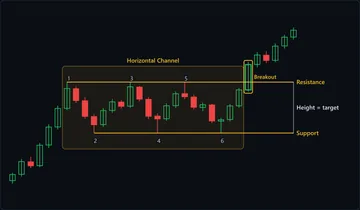
Horizontal Channel
A horizontal channel, also called a rectangle, is a sideways pattern in which price swings between a flat resistance and a flat support, touching each at least twice, and resolves only when a candle closes outside one of those two lines.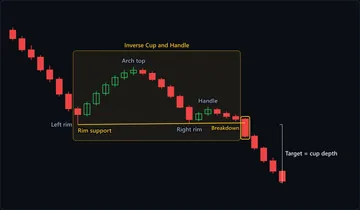
Inverse Cup and Handle
An inverse cup and handle is a bearish chart pattern in which price arches up and rolls back down in a rounded dome to a common support level, makes a small, weak bounce (the handle), and then breaks below the handle's low to start, or resume, a decline.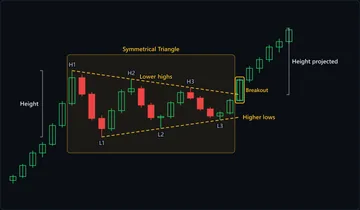
Symmetrical Triangle
A symmetrical triangle is a chart pattern in which a series of lower highs and higher lows converge at roughly equal angles toward a point, compressing price until it closes outside one of the two trendlines. It is traditionally read as continuing the trend that came before it.All patterns A–Z
| Pattern | Type | Bars | Also called |
|---|---|---|---|
| Ascending Channel | Continuation | Multiple | rising channel, upward channel, ascending price channel, rising trend channel |
| Ascending Triangle | Continuation | Multiple | ascending triangle pattern |
| Bear Flag | Continuation | Multiple | bear flag pattern, bearish flag, bear flag chart pattern |
| Bear Pennant | Continuation | Multiple | bearish pennant, bear pennant pattern, bearish pennant chart pattern |
| Bearish Engulfing | Bearish reversal | 2 | bearish engulfing candle, bearish engulfing candlestick, bearish engulfing bar |
| Bearish Kicker | Bearish reversal | 2 | bearish kicker candlestick, bearish kicking pattern, bearish kicker pattern |
| Bearish Wolfe Wave | Bearish reversal | Multiple | bearish wolfe wave pattern, wolfe wave top, bearish wolf wave |
| Broadening Bottom | Bullish reversal | Multiple | broadening bottom pattern, megaphone bottom, bullish broadening formation |
| Broadening Top | Bearish reversal | Multiple | megaphone top, broadening top pattern, bearish megaphone, broadening top formation |
| Bull Flag | Continuation | Multiple | bull flag pattern, flag pattern, bullish flag |
| Bull Pennant | Continuation | Multiple | bull pennant pattern, bullish pennant, bull pennant formation |
| Bullish Engulfing | Bullish reversal | 2 | engulfing candle, bullish engulfing candle, bullish outside bar |
| Bullish Kicker | Bullish reversal | 2 | bullish kicker candlestick, bullish kicking pattern, kicking bullish |
| Bullish Wolfe Wave | Bullish reversal | Multiple | bullish wolfe wave pattern, wolfe wave bottom, bullish wolf wave |
| Cup and Handle | Continuation | Multiple | cup with handle, cup-and-handle pattern |
| Dark Cloud Cover | Bearish reversal | 2 | dark cloud cover candlestick, dark cloud cover pattern, dark cloud pattern |
| Descending Channel | Continuation | Multiple | falling channel, downward channel, descending price channel, bearish channel pattern |
| Descending Triangle | Continuation | Multiple | descending triangle pattern, bearish triangle, descending triangle breakdown |
| Diamond Bottom | Bullish reversal | Multiple | diamond bottom pattern, bullish diamond pattern, diamond bottom chart pattern |
| Diamond Top | Bearish reversal | Multiple | diamond top pattern, bearish diamond pattern, diamond top formation, diamond reversal top |
| Doji | Indecision | 1 | doji candle, doji candlestick, long-legged doji |
| Double Bottom | Bullish reversal | Multiple | double bottom pattern, W bottom, W pattern |
| Double Top | Bearish reversal | Multiple | double top pattern, M top, M pattern |
| Dragonfly Doji | Bullish reversal | 1 | dragonfly doji candlestick, dragonfly doji pattern, dragonfly candle |
| Evening Star | Bearish reversal | 3 | evening star candlestick, evening star pattern, evening star candle |
| Falling Wedge | Continuation | Multiple | falling wedge pattern, descending wedge, bullish wedge |
| Gap Down | Continuation | 2 | gap down pattern, falling window, downside gap, bearish gap |
| Gap Up | Continuation | 2 | gap up pattern, bullish gap, rising window, upside gap |
| Gravestone Doji | Bearish reversal | 1 | gravestone candle, gravestone candlestick, gravestone doji pattern |
| Hammer | Bullish reversal | 1 | hammer candle, hammer candlestick, bullish pin bar |
| Hanging Man | Bearish reversal | 1 | hanging man candle, hanging man candlestick, bearish hammer |
| Head and Shoulders | Bearish reversal | Multiple | head and shoulders top, H&S pattern, head & shoulders |
| Horizontal Channel | Continuation | Multiple | rectangle pattern, rectangle chart pattern, trading range pattern, sideways channel |
| Inverse Cup and Handle | Continuation | Multiple | inverted cup and handle, inverted cup with handle, bearish cup and handle, upside-down cup and handle |
| Inverse Head and Shoulders | Bullish reversal | Multiple | head and shoulders bottom, reverse head and shoulders, inverted head and shoulders, inverse H&S |
| Inverted Hammer | Bullish reversal | 1 | inverted hammer candlestick, inverted hammer candle, inverse hammer |
| Island Reversal | Bearish reversal | Multiple | island reversal pattern, island top, island bottom, island gap reversal |
| Morning Star | Bullish reversal | 3 | morning star candlestick, morning star pattern |
| Piercing Line | Bullish reversal | 2 | piercing pattern, piercing line candlestick, bullish piercing pattern |
| Rising Wedge | Bearish reversal | Multiple | rising wedge pattern, ascending wedge, bearish wedge |
| Shooting Star | Bearish reversal | 1 | shooting star candle, shooting star candlestick |
| Spinning Top | Indecision | 1 | spinning top candlestick, spinning top candle, spinning top pattern |
| Symmetrical Triangle | Continuation | Multiple | symmetrical triangle pattern, symmetric triangle, coil pattern, symmetrical triangle breakout |
| Three Black Crows | Bearish reversal | 3 | 3 black crows, three black crows candlestick, three crows pattern |
| Three Inside Down | Bearish reversal | 3 | three inside down candlestick, 3 inside down, confirmed bearish harami |
| Three Inside Up | Bullish reversal | 3 | three inside up candlestick, 3 inside up, three inside up pattern, confirmed bullish harami |
| Three Outside Down | Bearish reversal | 3 | three outside down candlestick, 3 outside down, three outside down pattern, three outside down candle |
| Three Outside Up | Bullish reversal | 3 | three outside up candlestick, 3 outside up, three outside up pattern |
| Three White Soldiers | Bullish reversal | 3 | three white soldiers candlestick, 3 white soldiers, three advancing white soldiers |
| Triple Bottom | Bullish reversal | Multiple | triple bottom pattern, triple bottom formation, triple bottom chart pattern |
| Triple Top | Bearish reversal | Multiple | triple top pattern, triple top chart pattern, triple top formation, triple top reversal |
| Tweezer Bottom | Bullish reversal | 2 | tweezer bottom candlestick, tweezer bottom pattern, tweezer bottoms |
| Tweezer Top | Bearish reversal | 2 | tweezer top candlestick, tweezer tops, tweezer top pattern |
Recognising a pattern is a different skill from reading about one
Chart Guess turns this library into reps: a realistic candlestick chart, a call to make, and instant feedback with the pattern name. 53 patterns, no real money at risk. Playing requires a Chart Guess Pro subscription.