Spinning Top Candlestick Pattern
A spinning top is a single candle with a small real body and upper and lower wicks of similar length, showing that buyers and sellers each pushed price away from the open during the session and both were pulled back, so the trend's drive is hesitating.
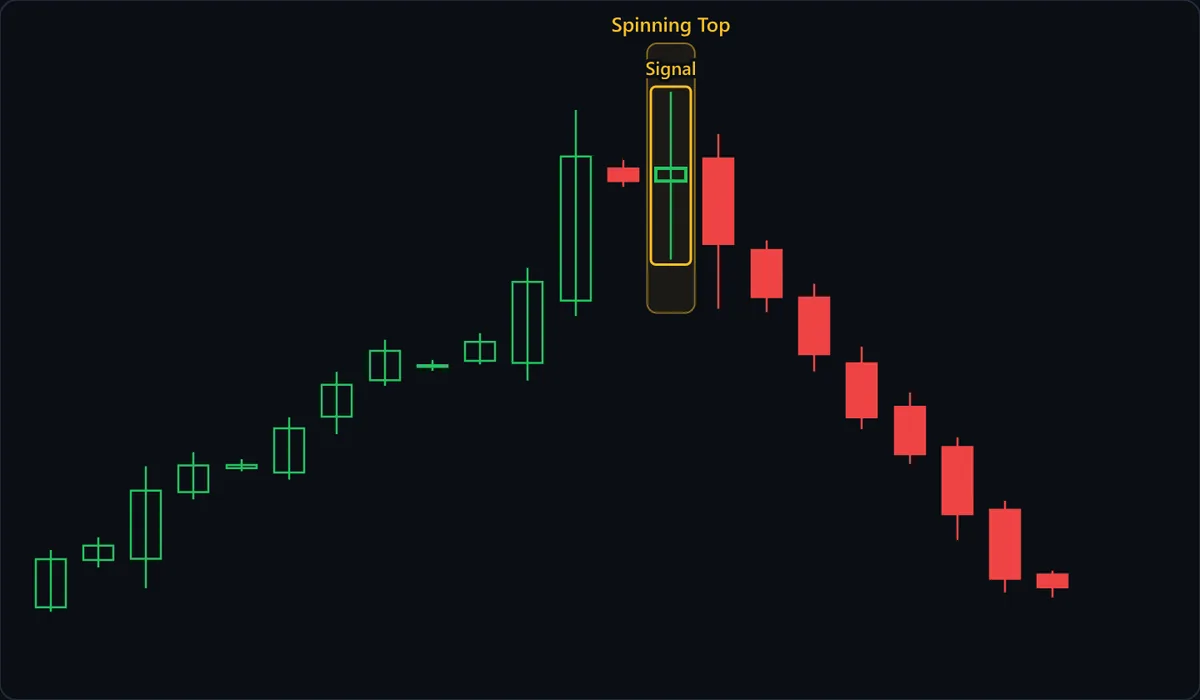
Chart data
| # | Open | High | Low | Close |
|---|---|---|---|---|
| 1 | 90.17 | 92.37 | 90 | 92.02 |
| 2 | 91.99 | 92.86 | 91.7 | 92.54 |
| 3 | 92.04 | 95.59 | 90.91 | 94.66 |
| 4 | 94.6 | 96.14 | 94.32 | 95.63 |
| 5 | 95.52 | 95.87 | 95.4 | 95.64 |
| 6 | 95.35 | 97.48 | 95.08 | 97.05 |
| 7 | 97.5 | 99.23 | 96.83 | 98.73 |
| 8 | 98.9 | 100.46 | 98.69 | 100.03 |
| 9 | 99.48 | 99.68 | 99.26 | 99.48 |
| 10 | 99.65 | 100.71 | 99.51 | 100.38 |
| 11 | 99.57 | 103.22 | 98.89 | 102.68 |
| 12 | 101.96 | 109.29 | 101.37 | 107.51 |
| 13 | 107.04 | 107.37 | 106.34 | 106.56 |
| 14 | 106.56 | 110 | 103.54 | 107.05 |
| 15 | 107.43 | 108.37 | 101.65 | 104.14 |
| 16 | 103.91 | 104.28 | 101.52 | 102.1 |
| 17 | 102.08 | 102.61 | 99.24 | 99.9 |
| 18 | 99.55 | 100.19 | 97.02 | 97.48 |
| 19 | 97.88 | 98.43 | 95.68 | 96.06 |
| 20 | 96.33 | 96.71 | 92.76 | 93.75 |
| 21 | 93.92 | 94.26 | 90.74 | 91.27 |
| 22 | 91.43 | 91.58 | 90.55 | 90.94 |
At a glance
| Type | Indecision |
|---|---|
| Direction | Neutral |
| Bars required | 1 candle |
| Family | Candlestick pattern |
| Evidence | Context dependent |
| Also called | spinning top candlestick, spinning top candle, spinning top pattern |
What timeframe does it work on?
On one- and five-minute charts a quiet bar with a small body and two short wicks is the default shape, so spinning tops there are mostly noise. A daily or weekly spinning top represents a whole session of two-way trade that went nowhere, which is worth noticing after a long run. In forex and crypto, where the daily close depends on your broker's or exchange's cutoff, check that the shape survives a different session boundary before leaning on it.
Anatomy of the pattern
- Small real body — Open and close finish close together, conventionally with the body no more than about a third of the high-to-low range. Color is irrelevant: the chart's spinning top closed slightly green and still preceded a decline.
- Upper wick — Buyers pushed price to a new high for the move during the session and could not hold it. On the chart the wick reaches the highest price of the whole advance, above the tall green candle two bars earlier, and that high was given back by the close.
- Lower wick — Sellers also drove price well below the open at some point in the session and lost that ground too. Roughly matching the upper wick is what separates a spinning top from a hammer-type candle, where only one side was rejected.
- Signal position — The candle labelled Signal sits at the top of an extended advance, just after a long green bar and a small red pause, exactly where a stall means something. The same candle in the middle of a sideways range carries no information.
- Range break — The spinning top's own high and low define the trade. The decisive event on the chart is the close below the low two bars later, not the spinning top itself.
How to identify it
- The real body is small relative to the full range — roughly a third of it or less — and sits near the middle of the candle.
- Both wicks are clearly longer than the body and broadly similar to each other; if one wick is at least twice the body and the other is small or missing, the candle is a hammer, hanging man, inverted hammer or shooting star, not a spinning top.
- The body has visible height. If open and close are effectively equal, the candle is a doji, which shares the meaning but is classified separately.
- It forms after a sustained trend or into a known support or resistance level, not inside a choppy range.
- The candle's range is at least normal for recent bars; a tiny spinning top on a dead, low-volume session says little about either side.
- Two or three consecutive spinning tops after a strong move strengthen the read that the trend has stalled.
How to trade it
Entry. Wait for the next candle, or the one after it, to close beyond the spinning top's range, and trade in that direction. After an advance, a close below the low is the reversal short (as on the chart). A strong close above the high is a continuation signal instead: it cancels the reversal read, and only traders willing to trade with the trend should take it long. Mirror this after a decline.
Stop. On the opposite side of the spinning top: above its high for a short, below its low for a long. A move back through the far extreme means the side you bet against regained control of the very bar that defined the stall, so the premise has failed.
Target. The nearest swing level in the direction of the break — the last pullback low in an uptrend, the last bounce high in a downtrend. A spinning top describes one session of hesitation, so treat it as a short-distance signal and reassess at that first level rather than projecting a full reversal.
What invalidates it
- Price closes beyond the spinning top in the direction of the prior trend with a strong, wide-bodied candle. The pause has resolved as continuation: the reversal read is finished, and any trade from here is a with-trend one.
- There was no meaningful trend before it. A spinning top inside a sideways range is just another balanced bar.
- One wick is at least twice the body and the other is small or missing. Then the candle is rejecting one side specifically and should be read as a hammer, hanging man, inverted hammer or shooting star.
- If neither of the next two candles closes outside the spinning top's range, the tie never broke and the setup has expired.
Often confused with
Spinning Top vs Doji: what's the difference?
Check the body. A doji's open and close are virtually identical, so its body is a line; a spinning top has a small but measurable box. Both signal indecision, but the doji's balance is more exact.
Spinning Top vs Hanging Man: what's the difference?
Compare the wicks. A hanging man after an advance has a long lower wick and little or no upper wick, showing sellers specifically tested lower prices. A spinning top has wicks of similar length on both sides, so it shows hesitation without favoring either side.
How reliable is the spinning top pattern?
Spinning tops sit in the context-dependent tier because the candle has no direction of its own: the classic candlestick references describe it as a sign that the market is losing momentum, and whether that becomes a top, a bottom or a brief pause depends on where it forms and which way the next close breaks. The shape is extremely common, so a spinning top with no trend behind it and no level beneath or above it is close to meaningless, and most of the information arrives with the candle that follows it. Any published success figure would depend on the body-size threshold, the trend filter and the confirmation rule chosen, so none is quoted here.
References
- Steve Nison. Japanese Candlestick Charting Techniques . Prentice Hall Press , 2001 . ISBN 978-0735201811.
- Thomas N. Bulkowski. Encyclopedia of Candlestick Charts . Wiley , 2008 . ISBN 978-0470182017.
Frequently asked questions
What does a spinning top mean?
Is a spinning top bullish or bearish?
How do you trade a spinning top?
Does a spinning top need confirmation?
What happens after a spinning top?
Practise spotting the spinning top
Reading about a pattern is not the same as recognising it under time pressure. Chart Guess drills 53 patterns as a 60-second game — read the chart, call BUY or SELL, get the pattern name instantly.