Doji Candle Meaning: What It Really Signals
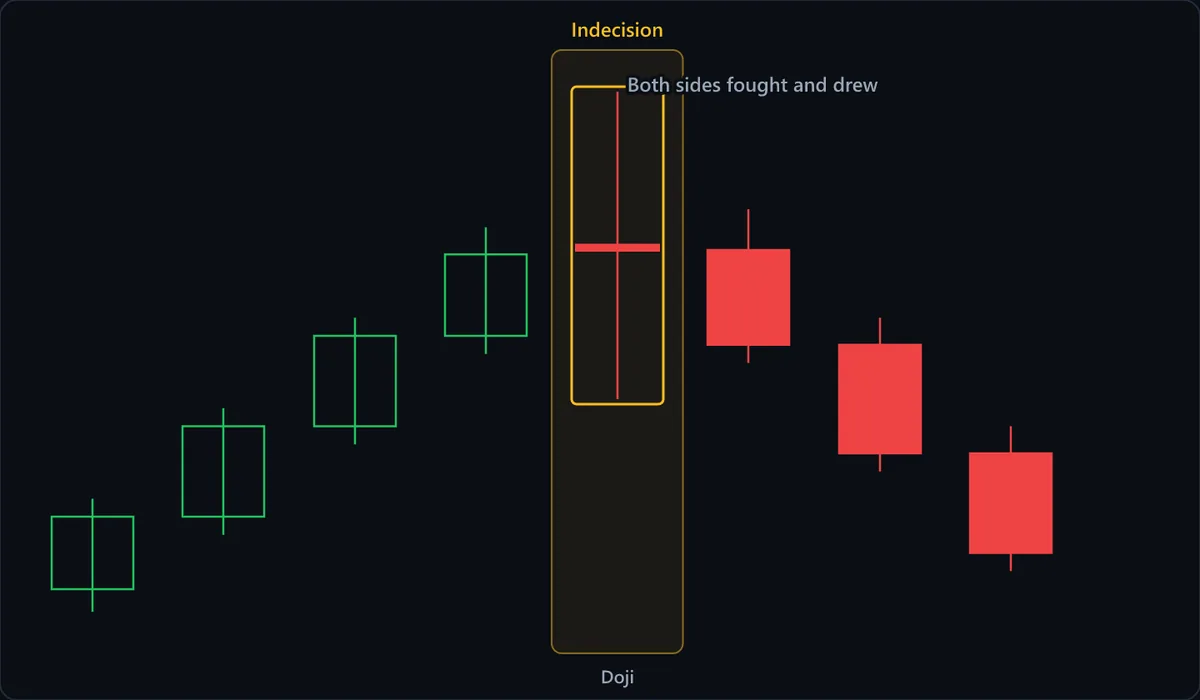
Chart data
| # | Open | High | Low | Close |
|---|---|---|---|---|
| 1 | 98 | 100 | 97.5 | 99.6 |
| 2 | 99.6 | 102 | 99.2 | 101.6 |
| 3 | 101.6 | 104 | 101.2 | 103.6 |
| 4 | 103.6 | 106 | 103.2 | 105.4 |
| 5 | 105.6 | 109 | 102.2 | 105.5 |
| 6 | 105.5 | 106.4 | 103 | 103.4 |
| 7 | 103.4 | 104 | 100.6 | 101 |
| 8 | 101 | 101.6 | 98.4 | 98.8 |
A doji forms when a candle's open and close are virtually equal, leaving a tiny or non-existent body with wicks extending above, below, or both. It represents one thing: indecision. Buyers and sellers fought all session and finished essentially even.
Is a doji bullish or bearish?
By itself, neither. A doji is a signal of balance, not direction. Its meaning comes entirely from two things:
- Where it appears. A doji after a long uptrend warns momentum is fading (potential top). The same doji after a long downtrend hints selling is exhausting (potential bottom). Mid-range, it means little.
- What confirms it. The candle after the doji decides the story. A strong red candle following a doji at a top confirms bearish reversal; a strong green candle after a doji at a bottom confirms bullish reversal.
The doji family
| Type | Shape | What it hints |
|---|---|---|
| Standard doji | Small body, wicks both sides | Pure indecision |
| Long-legged doji | Long wicks both sides | Strong indecision, high volatility |
| Dragonfly doji | Long lower wick, open/close at top | Potential bullish reversal (at a bottom) |
| Gravestone doji | Long upper wick, open/close at bottom | Potential bearish reversal (at a top) |
| Four-price doji | Open = high = low = close (a dash) | Extreme low activity / illiquidity |
How to read the two directional dojis
Dragonfly doji: price sold off hard during the session but buyers pushed it all the way back to the open. That long lower wick shows demand stepping in. At the bottom of a downtrend, it's a bullish clue.
Gravestone doji: the mirror image — buyers drove price up but sellers erased every gain by the close. At the top of an uptrend, it's a bearish clue.
Common mistakes
- Treating every doji as a reversal. Most dojis in the middle of a range mean nothing. Location is everything.
- Acting without confirmation. The doji only sets up the trade; the next candle takes it.
- Ignoring the timeframe. A doji on a daily chart carries far more weight than one on a one-minute chart.
Learn to read dojis in context
Chart Guess shows dojis where they actually appear — at tops, bottoms and mid-range — so you learn to weigh context, not just shapes. On iOS and Android.