Doji Candle
A doji is a single candlestick whose open and close are virtually identical, leaving a tiny or non-existent body. It represents indecision: buyers and sellers fought through the session and finished level, so the direction that follows depends entirely on context.
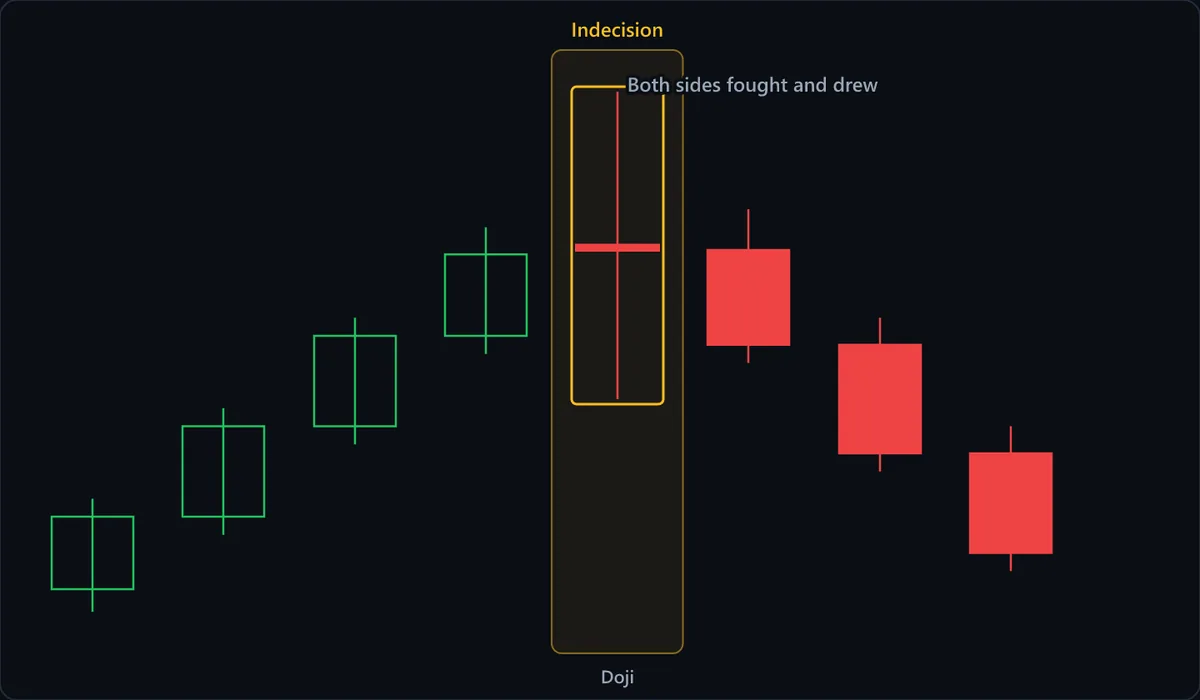
Chart data
| # | Open | High | Low | Close |
|---|---|---|---|---|
| 1 | 98 | 100 | 97.5 | 99.6 |
| 2 | 99.6 | 102 | 99.2 | 101.6 |
| 3 | 101.6 | 104 | 101.2 | 103.6 |
| 4 | 103.6 | 106 | 103.2 | 105.4 |
| 5 | 105.6 | 109 | 102.2 | 105.5 |
| 6 | 105.5 | 106.4 | 103 | 103.4 |
| 7 | 103.4 | 104 | 100.6 | 101 |
| 8 | 101 | 101.6 | 98.4 | 98.8 |
At a glance
| Type | Indecision |
|---|---|
| Direction | Neutral |
| Bars required | 1 candle |
| Family | Candlestick pattern |
| Evidence | Context dependent |
| Also called | doji candle, doji candlestick, long-legged doji |
What timeframe does it work on?
Dojis are extremely common on low timeframes, where a flat close is often just a quiet minute rather than a genuine standoff, and they carry almost no information there. On daily and weekly charts a doji after an extended move is a more meaningful pause. In very low-volatility instruments dojis appear constantly and should be ignored unless the candle's range is wide relative to recent bars.
Anatomy of the pattern
- Open equals close — The defining feature. In practice a body of a few ticks still counts — what matters is that the body is negligible against the candle's total range, not that the two prices match exactly.
- The wicks carry the story — Because there is no body to read, the wicks are the whole signal. Where they extend tells you which side pushed and failed, and that is what separates the doji variants from each other.
- Range relative to recent candles — A doji with a wide range after a strong trend is a genuine standoff. A doji whose entire range is tiny is simply a quiet session and means nothing at all.
- Position in the trend — A doji is a pause, not a direction. After a long advance it warns that buying pressure has stalled; after a decline it warns the same of selling. Mid-range it is noise.
How to identify it
- The body is negligible — open and close are within a few ticks of each other.
- The candle has a visible high-to-low range, ideally comparable to recent candles rather than unusually small.
- Standard doji: wicks extend on both sides roughly evenly, forming a cross.
- Dragonfly doji: open, high and close cluster at the top with a long lower wick — the more bullish variant, closest in meaning to a hammer.
- Gravestone doji: open, low and close cluster at the bottom with a long upper wick — the more bearish variant.
- Long-legged doji: unusually long wicks on both sides, indicating a wide but ultimately indecisive session.
How to trade it
Entry. A doji is not an entry signal on its own — it says nobody is in control, which is the opposite of a reason to take a position. The standard approach is to treat it as a setup bar and trade the break of its range: above the high for a long, below the low for a short, depending on the surrounding trend. The two directional variants are stronger: a dragonfly at support and a gravestone at resistance behave more like rejection candles.
Stop. On the opposite side of the doji's range from your entry. The candle's high and low are the two prices at which the standoff resolved in favour of one side, so they are the natural invalidation levels. A long-legged doji implies a wide stop, which is a reason to size smaller or skip the trade.
Target. Take it from the structure around the candle, never from the doji. Because the pattern signals a pause rather than a move, it implies no distance whatsoever — the nearest support or resistance, or a multiple of the risk taken, are the usual references.
What invalidates it
- The candle's whole range is tiny. A small-range doji is a quiet session, not a standoff, and there is no meaningful conflict to interpret.
- It appears mid-range with no trend on either side. A pause in the middle of indecision tells you nothing new.
- You treated it as directional. A standard doji is not bullish or bearish; reading one as a reversal signal without waiting for the range to break is the most common mistake with this pattern.
- You are on a timeframe where dojis form constantly. On a one-minute chart they are background texture, not signal.
Often confused with
Doji vs Bullish Engulfing: what's the difference?
An engulfing pattern's second candle has a large, decisive body. A doji has none. They sit at opposite ends of the conviction scale, which is why a doji following an engulfing candle undermines it.
Doji vs Hammer: what's the difference?
A hammer has a definite small body pushed to the top of its range with a long wick below and little above. A standard doji has wicks on both sides and effectively no body. The near-relative is the dragonfly doji, which is a doji with the hammer's shape — and it reads similarly.
Doji vs Spinning Top: what's the difference?
Check the body. A doji's open and close are virtually identical, so its body is a line; a spinning top has a small but measurable box. Both signal indecision, but the doji's balance is more exact.
How reliable is the doji pattern?
Asking how reliable a doji is misframes the pattern: it does not predict a direction, so there is no directional success rate to measure. What the standard references support is narrower and more useful — that a doji marks a genuine pause in the balance between buyers and sellers, and that the two directional variants, dragonfly and gravestone, behave much more like rejection candles than like the neutral cross. The practical consequence is that any strategy built on a doji has to specify what happens next: which way the range broke, whether the following candle confirmed, and where in the trend it appeared. A doji in isolation is information about the past session, not a forecast.
References
- Thomas N. Bulkowski. Encyclopedia of Candlestick Charts . Wiley , 2008 . ISBN 978-0470182017.
- Steve Nison. Japanese Candlestick Charting Techniques . Prentice Hall Press , 2001 . ISBN 978-0735201811.
Frequently asked questions
Is a doji bullish or bearish?
What are the different types of doji?
Do the open and close have to be exactly equal?
How do you trade a doji candle?
Practise spotting the doji
Reading about a pattern is not the same as recognising it under time pressure. Chart Guess drills 53 patterns as a 60-second game — read the chart, call BUY or SELL, get the pattern name instantly.