Hammer Candlestick Pattern
A hammer is a single candlestick with a long lower wick and a small body near the top of its range, forming after a decline: sellers drove price sharply down during the session and buyers recovered almost all of it before the close.
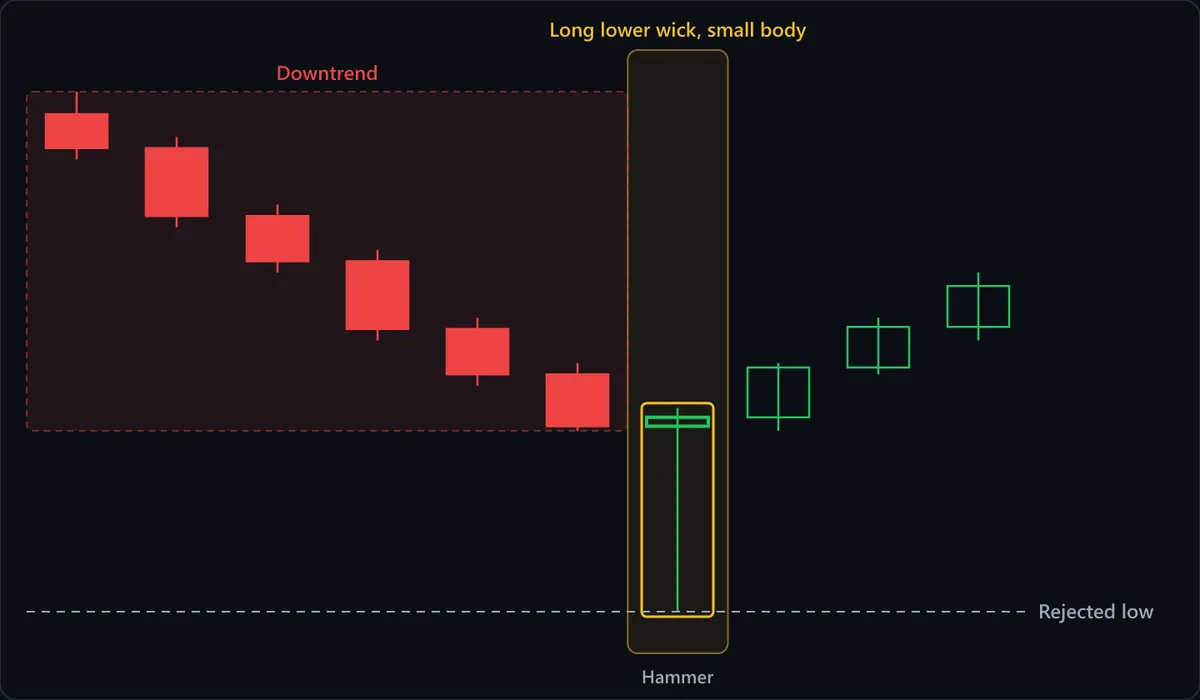
Chart data
| # | Open | High | Low | Close |
|---|---|---|---|---|
| 1 | 118 | 119 | 116 | 116.5 |
| 2 | 116.5 | 117 | 113 | 113.5 |
| 3 | 113.5 | 114 | 111 | 111.5 |
| 4 | 111.5 | 112 | 108 | 108.5 |
| 5 | 108.5 | 109 | 106 | 106.5 |
| 6 | 106.5 | 107 | 104 | 104.2 |
| 7 | 104.2 | 105 | 96 | 104.6 |
| 8 | 104.6 | 107 | 104 | 106.8 |
| 9 | 106.8 | 109 | 106.5 | 108.6 |
| 10 | 108.6 | 111 | 108 | 110.4 |
At a glance
| Type | Bullish reversal |
|---|---|
| Direction | Bullish |
| Bars required | 1 candle |
| Family | Candlestick pattern |
| Evidence | Context dependent |
| Also called | hammer candle, hammer candlestick, bullish pin bar |
What timeframe does it work on?
Hammers are common on every timeframe and mostly meaningless on the lowest ones, where a long lower wick can be a single spike in thin liquidity. On daily charts the wick represents a full session of rejected selling, which is a far stronger statement. The identical shape in an uptrend is a hanging man, so establishing the prior trend is not optional — it changes what the candle means.
Anatomy of the pattern
- Long lower wick — The defining feature, conventionally at least twice the height of the body. This is the ground sellers took during the session and then gave back — the whole signal lives in that rejection.
- Small body near the top — Open and close finish close together in the upper portion of the range. The body's colour matters much less than its position; a green body is marginally more constructive, but a red-bodied hammer is still a hammer.
- Little or no upper wick — A hammer should close near its high. A long upper wick as well makes it a high-wave or long-legged candle, which says indecision rather than rejection of lower prices.
- Position after a decline — The candle must arrive after a downtrend or into support. The same shape mid-range is noise, and in an uptrend it is a hanging man with the opposite implication.
How to identify it
- The lower wick is at least twice the length of the body — many traders require three times.
- The body sits in the upper third of the candle's total high-to-low range.
- The upper wick is small or absent, so the close is near the high.
- The candle appears after a run of declining prices, not in the middle of a range.
- The low of the wick reaches into a level that already mattered, such as prior support or a previous swing low.
How to trade it
Entry. Most approaches wait for the next candle to close above the hammer's high, treating the hammer as the setup and the following candle as the trigger. Entering at the hammer's close is possible but takes every failure at full size, and hammers fail often enough that the confirmation is usually worth its cost in entry price.
Stop. Below the hammer's low. That low is the whole premise of the trade — the level sellers reached and could not hold — so a stop above it has no logical basis. Long-wicked hammers therefore imply wide stops, and the correct response to a stop that is too wide is a smaller position.
Target. The pattern gives no target. Use the structure around it: the nearest resistance, the previous swing high, the top of the range it is reversing within, or a fixed multiple of risk. A hammer says something about the last session, not about the next twenty.
What invalidates it
- There was no prior downtrend. Then it is not a reversal signal at all — and if the preceding move was upward, the same shape is a hanging man, which is bearish.
- Price closes back below the hammer's low. The rejection the candle advertised did not hold.
- The candle also has a long upper wick. That is a long-legged or high-wave candle, signalling indecision on both sides rather than rejection of lower prices specifically.
- The wick is long only because of a data spike or an illiquid session. Check whether the low is plausible against neighbouring bars before treating it as real rejected selling.
- You required a green body. Body colour is a weak secondary consideration; insisting on it will make you skip valid hammers.
Often confused with
Hammer vs Bullish Engulfing: what's the difference?
A hammer is one candle; a bullish engulfing needs two, with the second body covering the first. If you need the previous bar to describe the signal, it is an engulfing rather than a hammer.
Hammer vs Doji: what's the difference?
A doji's open and close are virtually equal with wicks on both sides, and it says indecision. A hammer has a definite small body pushed to the top of the range and a long wick on one side only, and it says rejection. If the wicks are roughly symmetrical, it is not a hammer.
Hammer vs Dragonfly Doji: what's the difference?
Both have a long lower wick, but a hammer keeps a small visible body while a dragonfly's open and close are effectively one price. See a real box sitting on top of a wick at least twice its height, after a decline, and it is a hammer; the same box after an advance is a hanging man.
Hammer vs Hanging Man: what's the difference?
Identical candle, opposite trend. After a decline, a small body atop a long lower wick is a hammer, bought on a close above its high; after an advance it is a hanging man, sold on a close below its low. Read the trend first: the candle alone cannot tell you which one you have.
Hammer vs Inverted Hammer: what's the difference?
Both are bullish single candles after a decline, but the wick is on opposite ends. A hammer's long lower wick and high close show buyers already won the session. An inverted hammer closes near its low, so it needs the next candle to close above its high before it means anything.
Hammer vs Morning Star: what's the difference?
A hammer is one candle with a long lower wick; a morning star is a three-candle sequence, one candle per period. The star itself can be hammer-shaped. What makes it a morning star is the long bearish candle before it and the long bullish candle after it closing at least halfway up the first body.
Hammer vs Shooting Star: what's the difference?
A hammer is the mirror image: long lower wick, body near the high, after a decline (bullish). A shooting star has a long upper wick and body near the low after an advance. Check the wick first; an upper wick after a decline is an inverted hammer.
How reliable is the hammer pattern?
The hammer is one of the most widely taught single-candle patterns and one of the most misapplied, because the shape is common and the required context is frequently ignored. The standard references treat it as a genuine but weak standalone signal that improves substantially with confirmation and with location — at support, at a prior swing low, or after an extended decline. Its reliability tier here is context-dependent rather than moderate for a specific reason: an identical candle is bullish after a decline and bearish after an advance, where it is called a hanging man. No published success rate is meaningful without stating which trend filter and which wick-to-body ratio were used, and those choices vary between every study that has looked at it.
References
- Thomas N. Bulkowski. Encyclopedia of Candlestick Charts . Wiley , 2008 . ISBN 978-0470182017.
- Steve Nison. Japanese Candlestick Charting Techniques . Prentice Hall Press , 2001 . ISBN 978-0735201811.
Frequently asked questions
Does a hammer have to be green?
What is the difference between a hammer and a hanging man?
How long should the wick be for a valid hammer?
Is a hammer reliable on its own?
Practise spotting the hammer
Reading about a pattern is not the same as recognising it under time pressure. Chart Guess drills 53 patterns as a 60-second game — read the chart, call BUY or SELL, get the pattern name instantly.