Three Inside Up Candlestick Pattern
A three inside up is a three-candle bullish reversal after a decline: a long red candle, a small green candle whose body sits inside the red body (a bullish harami), then a green candle that closes above the first candle's open, taking back the entire red body.
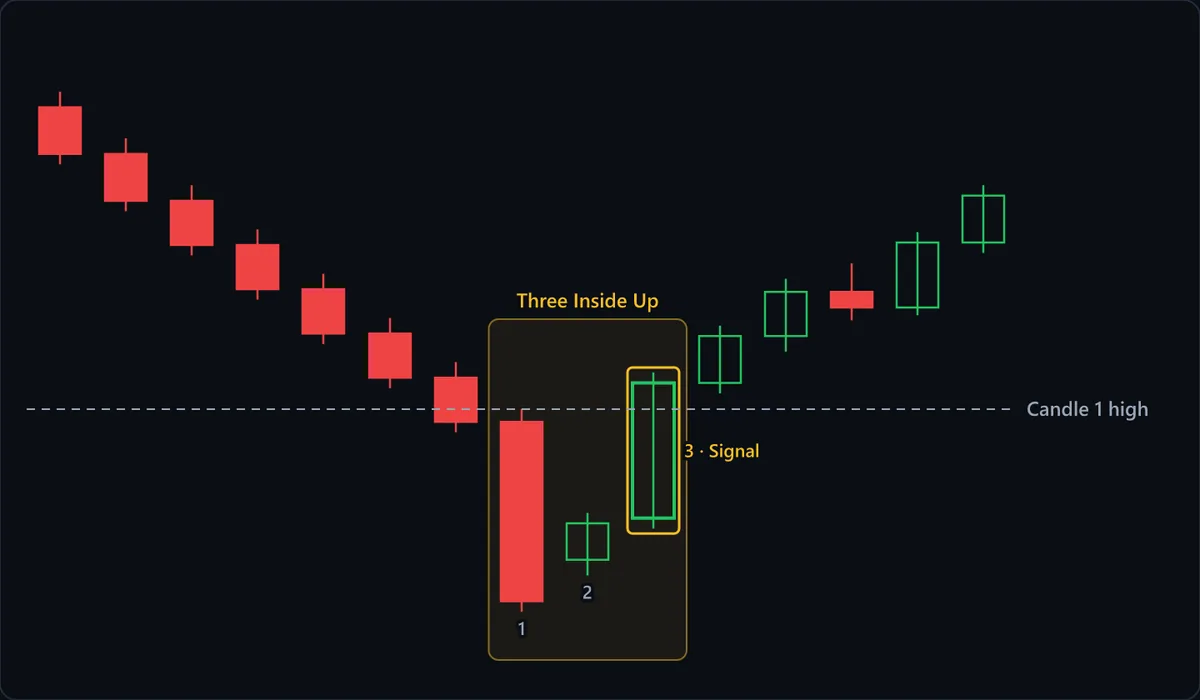
Chart data
| # | Open | High | Low | Close |
|---|---|---|---|---|
| 1 | 120 | 120.6 | 117.8 | 118.2 |
| 2 | 118.2 | 118.8 | 116 | 116.4 |
| 3 | 116.4 | 117 | 114.3 | 114.7 |
| 4 | 114.7 | 115.3 | 112.6 | 113 |
| 5 | 113 | 113.6 | 110.9 | 111.3 |
| 6 | 111.3 | 111.9 | 109.2 | 109.6 |
| 7 | 109.6 | 110.2 | 107.5 | 107.9 |
| 8 | 107.9 | 108.4 | 100.6 | 101 |
| 9 | 102.6 | 104.4 | 102 | 104 |
| 10 | 104.2 | 109.8 | 103.8 | 109.4 |
| 11 | 109.4 | 111.6 | 109 | 111.2 |
| 12 | 111.2 | 113.4 | 110.6 | 112.9 |
| 13 | 112.9 | 114 | 111.8 | 112.3 |
| 14 | 112.3 | 115.2 | 112 | 114.8 |
| 15 | 114.8 | 117 | 114.4 | 116.6 |
At a glance
| Type | Bullish reversal |
|---|---|
| Direction | Bullish |
| Bars required | 3 candles |
| Family | Candlestick pattern |
| Evidence | Moderate |
| Also called | three inside up candlestick, 3 inside up, three inside up pattern, confirmed bullish harami |
What timeframe does it work on?
Daily and 4-hour charts suit it best, because the middle candle has to represent a real session in which sellers had time to push lower and failed. On 1- and 5-minute charts small inside candles print in every quiet stretch, so the harami part says little. In crypto, which seldom gaps, candle 2 usually opens near the red close; judge it by where its body ends up.
Anatomy of the pattern
- Prior decline — Seven red candles step lower before the box. Without that run there is nothing to reverse; the same three candles in an uptrend are just a pullback and resumption.
- 1: the long red candle — Its body is nearly four times the size of the red bodies before it, and it prints the chart's lowest low. Its open is what candle 3 must close above; its low is where the setup is proven wrong.
- 2: the inside candle — A small green body that opens above the red close and finishes below the red open, wholly inside candle 1's body. Sellers never revisited the red close. That is the bullish harami: selling has stalled, nothing more yet.
- 3 · Signal — The green candle that closes above candle 1's open and, in this chart, above its high as well. Anyone who sold short inside the red candle is now losing money. That close is the trigger that turns the harami's stall into a reversal signal.
- Candle 1 high line — The dashed line marks the top of the red candle. Candle 3 closes over it, the stronger accepted version, and later candles keep their lows above it: follow-through the pattern itself cannot promise.
How to identify it
- A decline is already under way: several lower closes leading into candle 1, ideally running into a level that held before.
- Candle 1 is a long red candle whose body is clearly larger than the bodies of the candles just before it.
- Candle 2 is a small green candle whose body sits entirely within candle 1's body: it opens above the red close and closes below the red open. Its wicks may poke outside; its body may not.
- Candle 3 is green and closes above candle 1's open. Many traders want a close above candle 1's high, as in the chart, the stronger form. Bulkowski's minimum is looser, only a close above candle 2's close; this page uses the open rule because it shows the whole red body taken back.
- Judge candle 3 on its close. A spike above the red open that falls back before the close does not complete the pattern.
How to trade it
Entry. Buy at the close of candle 3. Closing above the red open is the confirmation, so waiting for a fourth candle mostly costs price. The alternative is buying a dip toward candle 2, which shortens the distance to the same stop below candle 1's low; in this chart that dip never comes. Buying during candle 2, before the reclaim exists, is the classic mistake.
Stop. Below candle 1's low, the deepest point sellers reached before stalling. A close beneath it says the decline has resumed and the harami was only a pause. Because candle 3 finishes near the red candle's top, this stop spans the whole pattern, so size the position to that distance rather than tucking the stop under candle 2.
Target. The nearest resistance or the previous swing high. The pattern shows buyers took the red candle back, not how far price travels next. Compare the room to that level with the full-pattern stop: with resistance close overhead, a textbook three inside up can still be a poor trade.
What invalidates it
- Price closes below candle 1's low. The reversal failed and the prior decline is back in charge.
- Candle 3 closes below candle 1's open. Some references, Bulkowski among them, still count it if it closes above candle 2's close, but on this page's rule it is a harami with a hesitant follow-up: buyers have not taken back the red body.
- There was no prior decline. In an uptrend the red candle is an ordinary pullback, and the two green candles confirm the trend rather than reverse it.
- Candle 2's body spills outside the red body. If it covers the red body entirely it is a bullish engulfing instead; if it merely overlaps, there is no harami at all.
- Candle 1 is no bigger than its neighbors. Fitting inside a small body proves little, and reclaiming its open is too small a move to show buyers took control.
Often confused with
Three Inside Up vs Morning Star: what's the difference?
Both are three-candle bottoms with a small middle candle. A morning star's middle candle sits below the red close, often gapped, and its third candle need only close past the red midpoint. A three inside up's middle body sits inside the red body, and candle 3 must close above the red open.
Three Inside Up vs Three Outside Up: what's the difference?
Look at the middle candle. In a three inside up it is small and sits inside the red body, so candle 3 does the reclaiming. In a three outside up it is large and engulfs the red body, so the reversal is already made and candle 3 only extends it.
Three Inside Up vs Three White Soldiers: what's the difference?
Three inside up starts with a long red candle and a small green candle contained inside it. In three white soldiers all three candles are long and green, and no candle sits wholly inside another.
How reliable is the three inside up pattern?
The three inside up sits in the moderate tier: it is covered in the standard candlestick references, but results depend heavily on the exact rules used. Nison defines the harami at its core; Bulkowski catalogs the three inside up as a named pattern. Its built-in strength is that candle 3 supplies the confirmation a bare harami lacks, screening out stalls that never turn. Its built-in weakness is lateness: by completion price has recovered the whole red candle, so the entry sits near the top of the pattern while the logical stop sits at its bottom. Definitions also differ on how far candle 3 must go: Bulkowski only requires a close above candle 2's close, many traders require a close above candle 1's open, and stricter ones want candle 1's high. Whether candle 2 must be green differs too, so no published success rate transfers to your version without checking its rules. It earns its keep after an extended decline into support, not in a sideways range.
References
- Thomas N. Bulkowski. Encyclopedia of Candlestick Charts . Wiley , 2008 . ISBN 978-0470182017.
- Steve Nison. Japanese Candlestick Charting Techniques . Prentice Hall Press , 2001 . ISBN 978-0735201811.
Frequently asked questions
What does a three inside up mean?
Is a three inside up bullish or bearish?
Is a three inside up the same as a bullish harami?
Does a three inside up need confirmation?
How reliable is the three inside up?
Practise spotting the three inside up
Reading about a pattern is not the same as recognising it under time pressure. Chart Guess drills 53 patterns as a 60-second game — read the chart, call BUY or SELL, get the pattern name instantly.