Inverted Hammer Candlestick Pattern
An inverted hammer is a single candlestick that forms after a decline, with a small body at the bottom of its range and a long upper wick: buyers pushed price well above the open during the session but could not hold it, so the close lands near the low.
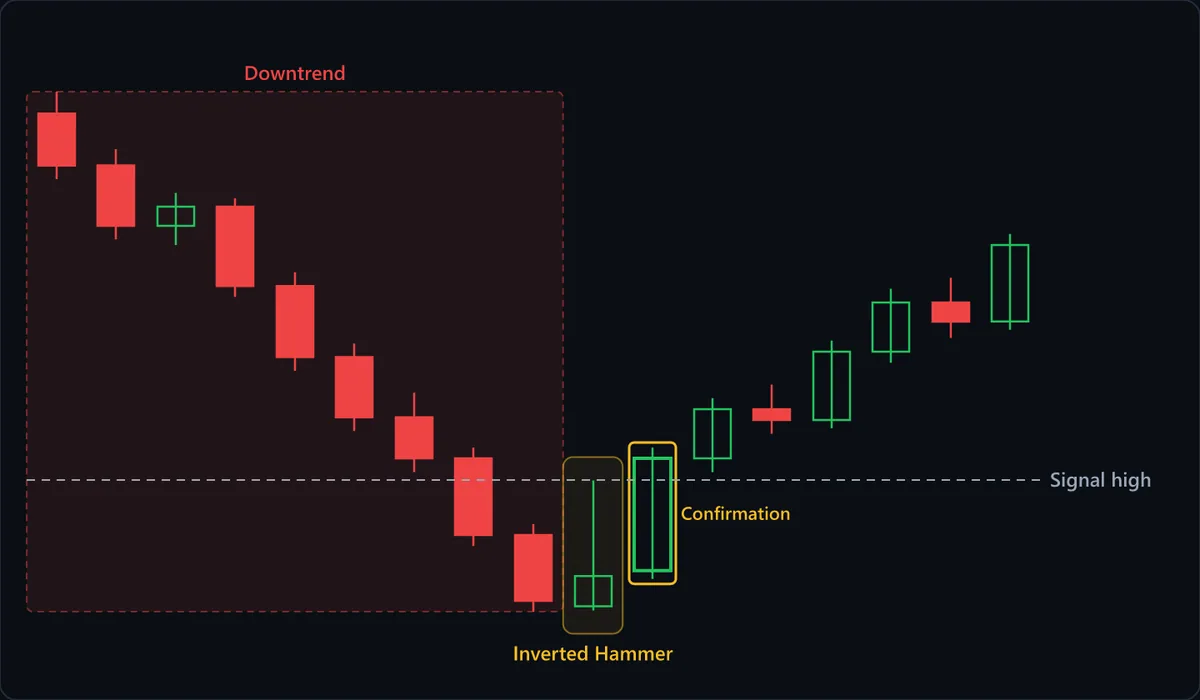
Chart data
| # | Open | High | Low | Close |
|---|---|---|---|---|
| 1 | 122 | 122.8 | 119.6 | 120.1 |
| 2 | 120.1 | 120.7 | 117.4 | 117.9 |
| 3 | 117.9 | 119.1 | 117.2 | 118.6 |
| 4 | 118.6 | 118.9 | 115.3 | 115.7 |
| 5 | 115.7 | 116.2 | 112.6 | 113.1 |
| 6 | 113.1 | 113.6 | 110.4 | 110.9 |
| 7 | 110.9 | 111.8 | 108.9 | 109.4 |
| 8 | 109.4 | 109.8 | 106.2 | 106.6 |
| 9 | 106.6 | 107 | 103.8 | 104.2 |
| 10 | 104 | 108.6 | 103.85 | 105.1 |
| 11 | 105.3 | 109.8 | 105 | 109.4 |
| 12 | 109.4 | 111.6 | 108.9 | 111.2 |
| 13 | 111.2 | 112.1 | 110.3 | 110.8 |
| 14 | 110.8 | 113.7 | 110.5 | 113.3 |
| 15 | 113.3 | 115.6 | 112.9 | 115.1 |
| 16 | 115.1 | 116 | 113.8 | 114.4 |
| 17 | 114.4 | 117.6 | 114.1 | 117.2 |
At a glance
| Type | Bullish reversal |
|---|---|
| Direction | Bullish |
| Bars required | 1 candle |
| Family | Candlestick pattern |
| Evidence | Context dependent |
| Also called | inverted hammer candlestick, inverted hammer candle, inverse hammer |
What timeframe does it work on?
The shape turns up on every timeframe, but on one-minute and five-minute charts a tall upper wick is often one burst of buy orders into thin liquidity. On a daily chart it is a whole session of attempted buying, a more meaningful probe. Because the candle closes near its low, it always needs the next bar to confirm it.
Anatomy of the pattern
- Downtrend — It only counts after a run of lower prices, like the nine bars in the shaded zone. That context is why the upper wick reads as a buying attempt; after an advance, the same shape is a shooting star.
- Long upper wick — The defining feature, conventionally at least twice the body's height. It records buyers lifting price well above the open, the first real push higher in the sequence, and then failing to keep it into the close.
- Small body at the bottom — Open and close sit near the session low. The chart shows a green body, which is marginally more constructive, but a red body is still valid. What matters is that the session closed near its low despite the push.
- Signal high — The top of the wick, drawn as the dashed line. It is the price buyers reached and could not hold, so it becomes the trigger: the setup only exists once the next candle closes above it.
- Confirmation — The candle after the inverted hammer, outlined on the chart, closing above the signal high. This is the bar that turns a failed probe into evidence that buyers came back and finished the job.
How to identify it
- The upper wick is at least twice the length of the body; many traders use three times.
- The body sits in the lower third of the candle's high-to-low range.
- There is little or no lower wick, so the open or close is near the session low.
- The candle appears after a clear decline. If the preceding bars were rising, you are looking at a shooting star.
- The body has to be visible. If open and close are effectively equal, the candle is a gravestone doji, not an inverted hammer.
- Not required, but the signal is stronger when the low sits at or near a prior swing low or support level rather than in open space mid-trend.
How to trade it
Entry. Buy only after the next candle closes above the inverted hammer's high. Unlike a hammer, this candle closes near its low, so on its own it shows that sellers pushed price back down and erased most of the buyers' rally. The confirmation close above the wick's top is what shows buyers returning and taking out the level they failed at, and it is the only part of the setup that actually points up.
Stop. Below the inverted hammer's low. That low is the bottom of the decline the candle is supposed to have ended, so a close beneath it means the downtrend simply continued. Because the entry sits above the wick, the distance to the stop covers the whole candle, so a tall inverted hammer calls for a smaller position, not a tighter stop.
Target. The candle gives no target of its own. Aim for the nearest resistance or the prior swing high, usually one of the lower highs left during the decline, and reassess there rather than assuming the whole decline will be retraced.
What invalidates it
- The next candle fails to close above the signal high. The probe was rejected and never retried, so there is no trade, only a candle with a long upper wick.
- Price closes below the inverted hammer's low. Sellers made a new low after the buying attempt, and the decline is intact.
- There is no follow-through within a couple of candles after confirmation. A reversal that stalls just above the signal high is drifting, not turning.
- The prior move was up, not down. The identical shape at the top of an advance is a shooting star, which reads as bearish.
- The candle also has a long lower wick. Long wicks on both ends mean indecision in both directions rather than a one-sided buying attempt.
Often confused with
Inverted Hammer vs Gravestone Doji: what's the difference?
A gravestone doji has the same long upper wick but no real body: open and close are at or very near the low. If you can see a distinct body, even a small one, it is an inverted hammer.
Inverted Hammer vs Hammer: what's the difference?
Both are bullish single candles after a decline, but the wick is on opposite ends. A hammer's long lower wick and high close show buyers already won the session. An inverted hammer closes near its low, so it needs the next candle to close above its high before it means anything.
Inverted Hammer vs Shooting Star: what's the difference?
Same candle, opposite location. After a decline it is an inverted hammer and a possible bullish turn; after an advance it is a shooting star and a warning of a top. Look at the five to ten bars before it, not at the candle itself.
How reliable is the inverted hammer pattern?
The standard candlestick references treat the inverted hammer as a weaker signal than the hammer, and the reason is in its shape: it closes near its low, so sellers erased most of the rally it records and the bullish reading rests on the attempt rather than the result. That is why the classic definition demands confirmation from the next candle. Its tier is context-dependent rather than moderate because, like the hammer, the identical candle means the opposite after an advance, where it is called a shooting star. No published success rate is meaningful unless it states the trend filter, the wick-to-body ratio and whether a confirmation close was required.
References
- Steve Nison. Japanese Candlestick Charting Techniques . Prentice Hall Press , 2001 . ISBN 978-0735201811.
- Thomas N. Bulkowski. Encyclopedia of Candlestick Charts . Wiley , 2008 . ISBN 978-0470182017.
Frequently asked questions
What does an inverted hammer mean?
Is an inverted hammer bullish or bearish?
Does an inverted hammer need confirmation?
How do you trade an inverted hammer?
What happens after an inverted hammer?
Practise spotting the inverted hammer
Reading about a pattern is not the same as recognising it under time pressure. Chart Guess drills 53 patterns as a 60-second game — read the chart, call BUY or SELL, get the pattern name instantly.