Gravestone Doji Candlestick Pattern
A gravestone doji is a candle shaped like an upside-down T, a long upper wick over open, low and close bunched at the bottom: buyers rallied during the session and sellers erased the gain by the close, so when it caps an advance it warns the rally may be failing.
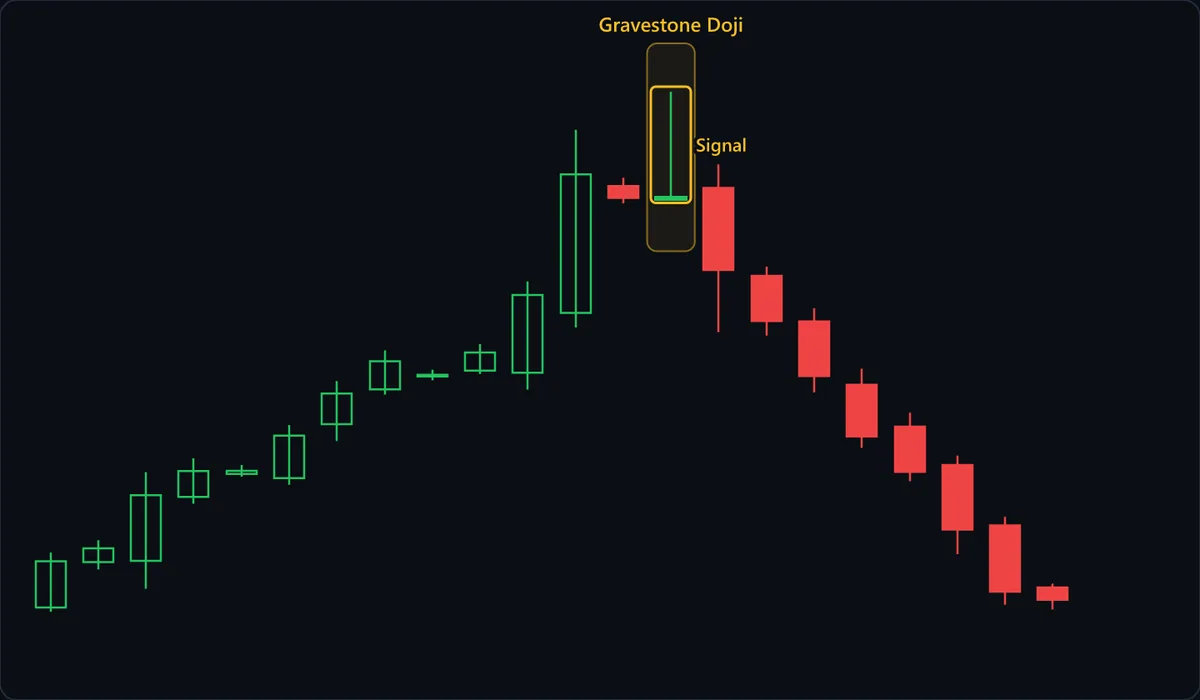
Chart data
| # | Open | High | Low | Close |
|---|---|---|---|---|
| 1 | 90.16 | 92.28 | 90 | 91.94 |
| 2 | 91.91 | 92.75 | 91.63 | 92.44 |
| 3 | 91.96 | 95.37 | 90.88 | 94.48 |
| 4 | 94.42 | 95.9 | 94.15 | 95.41 |
| 5 | 95.3 | 95.64 | 95.19 | 95.42 |
| 6 | 95.14 | 97.18 | 94.88 | 96.77 |
| 7 | 97.21 | 98.87 | 96.56 | 98.39 |
| 8 | 98.55 | 100.05 | 98.35 | 99.63 |
| 9 | 99.11 | 99.3 | 98.9 | 99.11 |
| 10 | 99.27 | 100.29 | 99.14 | 99.97 |
| 11 | 99.19 | 102.7 | 98.54 | 102.18 |
| 12 | 101.49 | 108.53 | 100.93 | 106.82 |
| 13 | 106.37 | 106.69 | 105.7 | 105.91 |
| 14 | 105.91 | 110 | 105.91 | 105.93 |
| 15 | 106.3 | 107.2 | 100.75 | 103.14 |
| 16 | 102.92 | 103.27 | 100.62 | 101.18 |
| 17 | 101.16 | 101.67 | 98.43 | 99.06 |
| 18 | 98.73 | 99.34 | 96.3 | 96.74 |
| 19 | 97.12 | 97.65 | 95.02 | 95.38 |
| 20 | 95.64 | 96 | 92.21 | 93.16 |
| 21 | 93.32 | 93.65 | 90.27 | 90.77 |
| 22 | 90.93 | 91.08 | 90.09 | 90.46 |
At a glance
| Type | Bearish reversal |
|---|---|
| Direction | Bearish |
| Bars required | 1 candle |
| Family | Candlestick pattern |
| Evidence | Context dependent |
| Also called | gravestone candle, gravestone candlestick, gravestone doji pattern |
What timeframe does it work on?
On one-minute charts of thin markets a gravestone can be one stray trade above an otherwise flat bar. Daily and weekly gravestones carry the weight: open a lower timeframe and the bar unpacks into a full round trip, a rally to the high and a sell-off of the same size back to the open. The reversal has already happened inside the bar; the next session shows whether the selling continues.
Anatomy of the pattern
- The rally into the box — Green candles climb to the tallest bar of the run, then comes the first red candle, a small one. The gravestone needs that advance: its message is that the rally's latest push failed.
- Long upper wick — Nearly the whole Signal candle, climbing past the tall green bar's high to the top of the chart. Buyers reached a new high and none of it survived the close; the taller the wick against recent candles, the bigger the failed push.
- Flat base at the bottom — Open, low and close share the bottom of the range: the candle opened at the red close, finished a hair above it, with no wick below. The sliver of body is green, which changes nothing.
- The high and the low — The wick's top is the furthest buyers got, so the stop and the invalidation both live there. The low is the trigger: at the Signal close, price is only back at its open, and a close beneath that low first proves sellers can push past the starting line.
How to identify it
- Open and close match so closely that the body has no height worth measuring next to the candle's range; screeners differ on the exact cutoff.
- Open, low and close sit together at the bottom, with no lower wick or only a stub.
- The upper wick is almost the entire candle, and the range is wide by recent standards rather than a quiet bar with a flick on top.
- It follows a rise, ideally a steep one or a push into an old high or resistance level.
- The next candle closes below the gravestone's low; until one does, it is a warning, not a signal.
How to trade it
Entry. The standard entry is a short on the next candle's close, taken only if that close is below the gravestone's low. At its own close the gravestone is only back at its open, so it shows rejected buying but no selling below the starting line; the close under the low supplies that missing evidence.
Stop. Above the gravestone's high, the furthest buyers reached; a close beyond it means they have retaken the whole rejected rally. The stop is wide by construction: entry under the low and stop over the high put the risk beyond the candle's full range. Tucking it inside the wick parks it at prices buyers already reached that session, so size down instead.
Target. One candle projects no distance, so the first target is whatever support sits below the gravestone's low, typically the prior swing low. Here that is the last pause on the way up, which the slide reaches three candles after the Signal. Check it first: with a stop this wide, support can easily sit closer than the stop, as it does here, and then the trade needs a lower level or should be skipped.
What invalidates it
- A close above the gravestone's high. Buyers have absorbed all the selling that drew the wick, and the apparent top has become a level they broke.
- No close below the low on the next candle. Then there is no entry, and a gravestone followed by an inside or higher candle has so far only interrupted the rally.
- It formed during a decline. With no advance to reject there is no top to call: the wick may be a bounce sellers capped or, as with an inverted hammer, an early try at a bottom, and only the following closes settle which.
- The base is not at the bottom. A lower wick longer than a stub lifts the open and close toward mid-range, making it a standard or long-legged doji: indecision, not rejection of higher prices.
Often confused with
Gravestone Doji vs Dragonfly Doji: what's the difference?
See which end holds the three matching prices. A gravestone keeps open, low and close at its foot, under a tall wick, and warns of a top after a rally; a dragonfly keeps open, high and close at its head, over a long lower wick, and warns of a bottom after a decline.
Gravestone Doji vs Inverted Hammer: what's the difference?
Same silhouette, different body and setting. An inverted hammer has a small visible body under its long upper wick and follows a decline, where a close above its high hints at a bottom. A gravestone has no real body and reads bearish after a rally.
Gravestone Doji vs Shooting Star: what's the difference?
Look at the body. A shooting star keeps a small but visible real body at the bottom of its range; a gravestone doji's open and close match, so its body is a flat line. Both need a rally first and both are traded on a close below the low.
How reliable is the gravestone doji pattern?
The standard candlestick references describe the gravestone as a bearish signal at market tops, one of the doji family's two directional members. It rates context-dependent here because that reading holds in only one place: after a decline the identical bar may record a capped bounce or an inverted-hammer-style bottom attempt, and in a sideways range it is noise. Definitions also split the gravestone from the shooting star at different body sizes, so two tests of the gravestone may not be counting the same candles. In its favor, the invalidation is unambiguous: a close above the high. Here the slide gave back nearly all of the rally; the next gravestone may stall at the first support instead.
References
- Steve Nison. Japanese Candlestick Charting Techniques . Prentice Hall Press , 2001 . ISBN 978-0735201811.
- Thomas N. Bulkowski. Encyclopedia of Candlestick Charts . Wiley , 2008 . ISBN 978-0470182017.
Frequently asked questions
What does a gravestone doji mean?
Is a gravestone doji bullish or bearish?
How do you trade a gravestone doji?
Is a green gravestone doji bullish?
How reliable is the gravestone doji?
Practise spotting the gravestone doji
Reading about a pattern is not the same as recognising it under time pressure. Chart Guess drills 53 patterns as a 60-second game — read the chart, call BUY or SELL, get the pattern name instantly.