Evening Star Candlestick Pattern
An evening star is a three-candle bearish reversal at the top of an advance: a long green candle, a small-bodied candle that stalls above it, and a long red candle that closes at least halfway down the first candle's body.
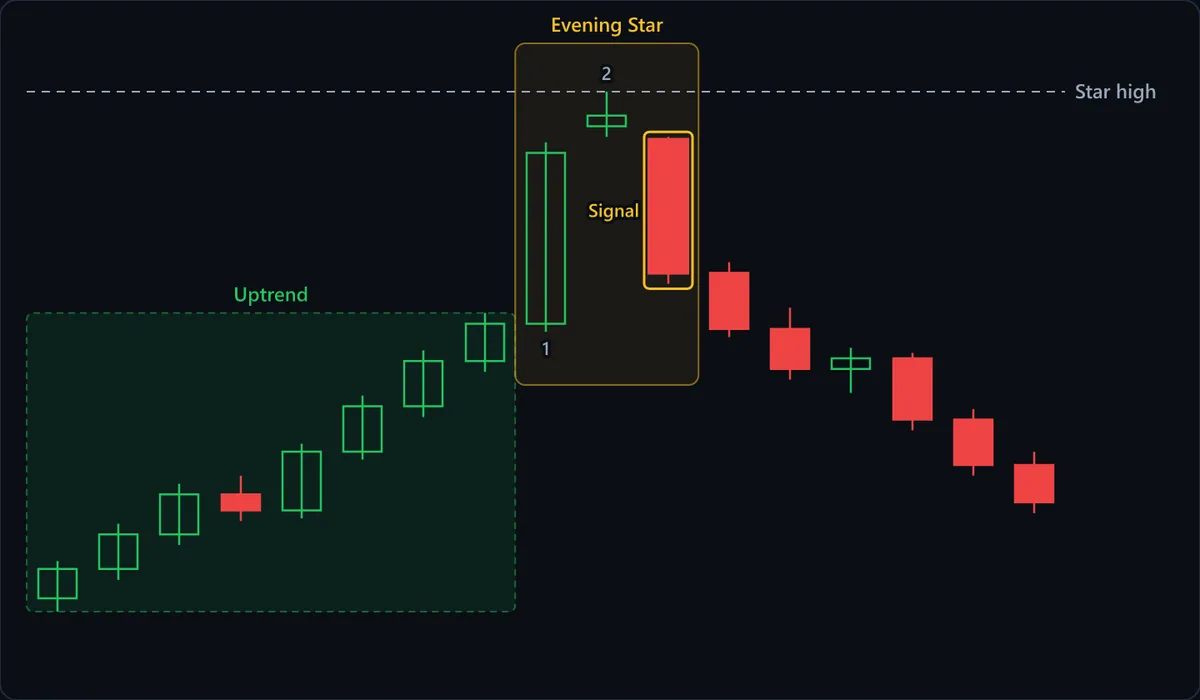
Chart data
| # | Open | High | Low | Close |
|---|---|---|---|---|
| 1 | 92 | 93.4 | 91.5 | 93.1 |
| 2 | 93.1 | 94.8 | 92.7 | 94.4 |
| 3 | 94.4 | 96.3 | 94 | 95.9 |
| 4 | 95.9 | 96.6 | 94.9 | 95.3 |
| 5 | 95.3 | 97.8 | 95 | 97.5 |
| 6 | 97.5 | 99.6 | 97.2 | 99.2 |
| 7 | 99.2 | 101.3 | 98.8 | 100.9 |
| 8 | 100.9 | 102.7 | 100.5 | 102.3 |
| 9 | 102.3 | 109.1 | 102 | 108.7 |
| 10 | 109.7 | 111 | 109.3 | 110.1 |
| 11 | 109.2 | 109.3 | 103.8 | 104.2 |
| 12 | 104.2 | 104.6 | 101.8 | 102.1 |
| 13 | 102.1 | 102.9 | 100.2 | 100.6 |
| 14 | 100.6 | 101.4 | 99.7 | 101 |
| 15 | 101 | 101.2 | 98.3 | 98.7 |
| 16 | 98.7 | 99.1 | 96.6 | 97 |
| 17 | 97 | 97.5 | 95.2 | 95.6 |
At a glance
| Type | Bearish reversal |
|---|---|
| Direction | Bearish |
| Bars required | 3 candles |
| Family | Candlestick pattern |
| Evidence | Moderate |
| Also called | evening star candlestick, evening star pattern, evening star candle |
What timeframe does it work on?
The evening star forms on any timeframe, but the textbook version with gaps on both sides of the star belongs to markets that close. Daily stock charts often show the star opening above the first close and the red candle opening below the star; crypto and most forex pairs trade nonstop, so traders there accept a star whose body simply sits above the first body. Below the hourly chart, a small middle candle is often a quiet session lull rather than buyers running dry.
Anatomy of the pattern
- Uptrend — The run of mostly green candles in the shaded zone. Without it there is no rally to exhaust, and the three candles that follow would be a wobble inside a range.
- Candle 1 — A long green candle, the largest body of the whole advance in this chart. It draws in late buyers, and they are the fuel for the reversal: they are the ones left stranded when the next two candles fail them.
- Candle 2, the star — A small body that opens above candle 1's close and goes almost nowhere. Its color does not matter; here it is green but tiny. After a session as forceful as candle 1, a candle that cannot extend says demand has thinned out at these prices.
- Signal candle — The long red third candle and the actual trigger. It opens below the star's body and closes well beneath the midpoint of candle 1's body, handing back most of that candle's gain in a single session.
- Star high — The dashed line at the star's high, the highest price of the move. It anchors both the stop and the invalidation: while price stays below it, the top the pattern describes is intact.
How to identify it
- A visible advance of several candles comes first, ideally into a prior high or resistance level.
- The first candle is green with a body clearly longer than the recent average, so the rally looks strongest just before it stalls.
- The second candle has a small body of either color sitting above the first candle's body; a gap above the first close strengthens it but is optional in 24-hour markets.
- The third candle is red, ideally opens below the star's body (a gap there adds weight but is not required), and closes at or below the midpoint of the first candle's body.
- The star's high is the highest point of the three candles, so the pattern marks the peak of the move rather than a stall beneath it.
- Optional confirmation: where volume is available, heavier volume on the red third candle than on the star adds weight to the signal.
How to trade it
Entry. The standard entry is a sell on the close of the third candle, the moment the pattern is complete; selling while the star is still forming is a bet on a pause that has not yet turned. The alternative is to wait for a bounce back toward the star after the signal candle, which buys a closer stop at the risk of missing the move, as in the chart, where price never returned.
Stop. Above the star's high, the Star high line in the chart. That price is the ceiling the pattern says buyers could not break, so it is the level the pattern itself defines; a stop placed beneath it can be hit by an ordinary retest of the star without the top being broken. Because entry follows a long red candle, the distance to the stop is often large; shrink the position to fit it rather than pulling the stop lower.
Target. The first target is the open of the first green candle, where the final surge began; reaching it means that whole surge has been erased. The second is the previous swing low of the advance. In the chart the first target is passed on the very next candle, and the decline then reaches roughly the level of the small pullback inside the uptrend.
What invalidates it
- Price closes above the star's high. The peak the pattern depends on has been taken out and buyers have reclaimed it.
- The third candle is small or closes only shallowly into the first candle's body. That is hesitation rather than reversal, and in a strong uptrend it is frequently followed by new highs.
- There was no meaningful advance beforehand. Inside a sideways range the shape says nothing about an exhausted rally.
- The middle candle is as large as its neighbors. Without a genuine stall in the center, the sequence is just a green candle followed by a red one.
Often confused with
Evening Star vs Dark Cloud Cover: what's the difference?
A dark cloud cover is two candles: the red candle follows the long green one directly, opening above its high and closing below its midpoint. If a small stalling candle sits between the green and the red, it is an evening star instead.
Evening Star vs Island Reversal: what's the difference?
An evening star gaps only by the star's real body, so wicks can overlap, and its third candle closes deep into the first body. An island needs full range gaps on both sides and can hold any number of candles. A star gapped by its whole range on both sides is an abandoned baby, a one-candle island.
Evening Star vs Shooting Star: what's the difference?
A shooting star is one candle with a long upper wick and a small body near its low. It can appear as the evening star's middle candle, but alone it is only a warning; the evening star also needs the long red candle that closes deep into the first green body.
Evening Star vs Three Inside Down: what's the difference?
Both put a small candle between a long green one and a red one. An evening star's middle candle sits at or above the top of the green body, often gapping up; a three inside down's middle body sits inside the green body, below its close.
Evening Star vs Three Outside Down: what's the difference?
Both are three-candle tops, but the middle candle differs. An evening star's middle is a small stalled body at the top between a long green and a long red; a three outside down's middle is the biggest candle of the three and does the reversing itself.
How reliable is the evening star pattern?
The evening star is among the best-known candlestick tops, and it carries more weight than one-candle warnings such as the shooting star or hanging man because it captures a complete turn: a strong advance, a failure to extend, and a decisive red candle that supplies its own confirmation. It is rated moderate here rather than well documented because the definition is not fixed. Sources disagree on whether gaps are required around the star, whether a doji or any small body counts, and how far the third candle must close into the first; each version counts different examples, and the gap rule cannot apply in markets that never close. Location matters too: at a prior high after an extended rally it is a meaningful top, while inside a steep, young uptrend it often marks only a brief rest.
References
- Steve Nison. Japanese Candlestick Charting Techniques . Prentice Hall Press , 2001 . ISBN 978-0735201811.
- Thomas N. Bulkowski. Encyclopedia of Candlestick Charts . Wiley , 2008 . ISBN 978-0470182017.
Frequently asked questions
What does an evening star candlestick mean?
Is an evening star bullish or bearish?
How do you trade an evening star?
What is an evening doji star?
What happens after an evening star?
Practise spotting the evening star
Reading about a pattern is not the same as recognising it under time pressure. Chart Guess drills 53 patterns as a 60-second game — read the chart, call BUY or SELL, get the pattern name instantly.