Dark Cloud Cover Candlestick Pattern
A dark cloud cover is a two-candle bearish reversal pattern at the top of an advance: after a long green candle, a red candle opens above the green candle's high, then closes below the midpoint of the green body but still above the green candle's open.
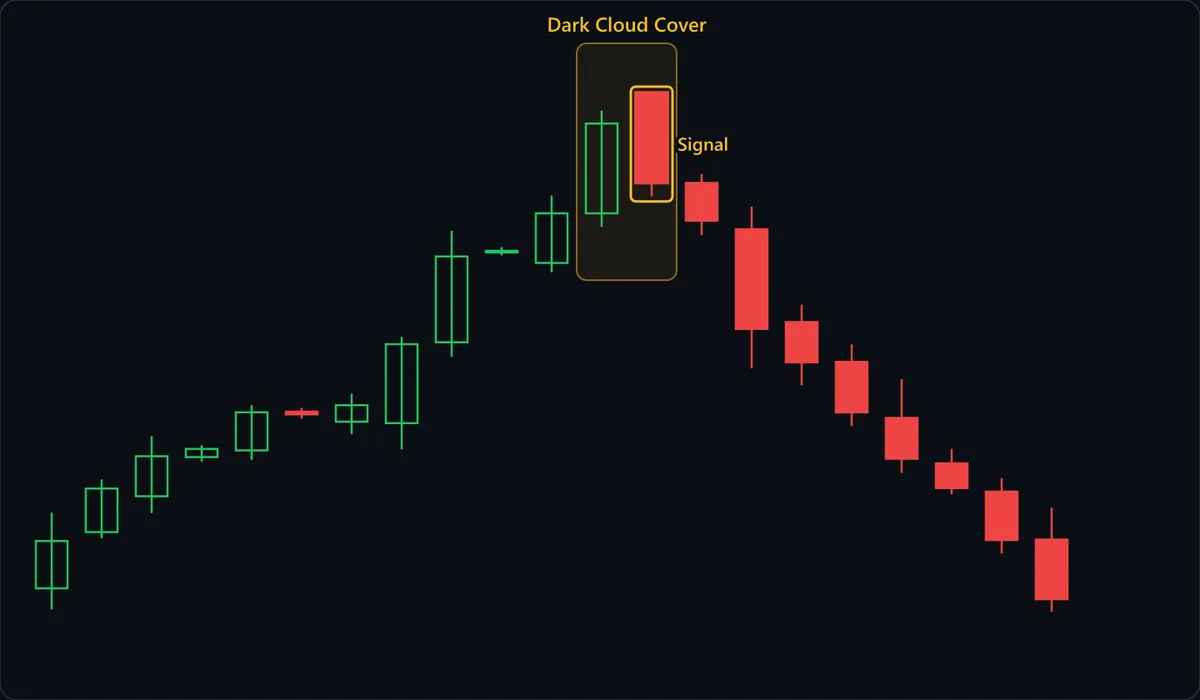
Chart data
| # | Open | High | Low | Close |
|---|---|---|---|---|
| 1 | 90.9 | 93.81 | 90.08 | 92.72 |
| 2 | 93.06 | 95.09 | 92.82 | 94.74 |
| 3 | 94.44 | 96.75 | 93.79 | 95.98 |
| 4 | 95.95 | 96.4 | 95.77 | 96.26 |
| 5 | 96.2 | 97.95 | 95.84 | 97.67 |
| 6 | 97.69 | 97.84 | 97.42 | 97.59 |
| 7 | 97.31 | 98.38 | 96.83 | 97.94 |
| 8 | 97.25 | 100.57 | 96.24 | 100.29 |
| 9 | 100.36 | 104.65 | 99.81 | 103.66 |
| 10 | 103.86 | 104.02 | 103.7 | 103.88 |
| 11 | 103.41 | 106.01 | 103.05 | 105.32 |
| 12 | 105.32 | 109.28 | 104.8 | 108.77 |
| 13 | 109.96 | 110 | 105.97 | 106.5 |
| 14 | 106.49 | 106.83 | 104.48 | 105.04 |
| 15 | 104.7 | 105.58 | 99.36 | 100.87 |
| 16 | 101.14 | 101.8 | 98.7 | 99.59 |
| 17 | 99.61 | 100.28 | 97.15 | 97.67 |
| 18 | 97.45 | 98.94 | 95.34 | 95.88 |
| 19 | 95.71 | 96.26 | 94.51 | 94.75 |
| 20 | 94.62 | 95.14 | 92.24 | 92.76 |
| 21 | 92.77 | 94 | 90 | 90.48 |
At a glance
| Type | Bearish reversal |
|---|---|
| Direction | Bearish |
| Bars required | 2 candles |
| Family | Candlestick pattern |
| Evidence | Moderate |
| Also called | dark cloud cover candlestick, dark cloud cover pattern, dark cloud pattern |
What timeframe does it work on?
The pattern needs an opening gap above the prior high, so it is a daily-chart signal for markets that close overnight, like stocks and many futures. Bars inside one intraday session rarely gap, so the strict version mostly appears on the first bar after the open. In crypto, which never closes, and forex, which only pauses at weekends, each candle opens near the last close, so the true pattern almost never forms.
Anatomy of the pattern
- The rally into it — Eleven candles climb before the shaded box. The pattern reverses optimism, so it needs a market full of comfortable buyers to catch out.
- Long green candle — The left candle in the box, closing near its high with the biggest body of the run. It is the yardstick: cutting halfway into a big green body costs buyers a real gain, while halfway into a small one barely registers.
- Gap above the high — The outlined Signal candle opens at 109.96, above the green candle's 109.28 high, not just its close. At that open the bulls look unstoppable, and anyone buying pays a fresh high.
- Close below the midpoint — The Signal candle closes at 106.5, below the green body's midpoint of 107.045 (open 105.32 plus close 108.77, halved) yet still above 105.32. A close below that open would make it a bearish engulfing.
- The Signal candle's high — At 110, barely above the open: buyers got almost nothing from the gap. It anchors the stop and the invalidation, since a close above it puts every buyer from that open back in profit.
How to identify it
- Price has been rising into the pair, ideally an extended run into a prior peak or resistance zone.
- The first candle is a long green candle, its body clearly bigger than its neighbors' bodies.
- The second candle opens above the first candle's high — above the wick, not just the close.
- The second candle closes below the first candle's body midpoint: the green open plus close, halved.
- That close stays above the first candle's open; below it, the pair is a bearish engulfing instead.
- Stronger still if the second candle finishes near its own low, a sign sellers were still pressing at the close.
How to trade it
Entry. Sell at the Signal candle's close, acting on a finished signal at a lower price, or wait for a bounce to the green body's midpoint, where buyers trapped by the gap tend to sell. The bounce gets a better price but may never fill: here the next candle peaks at 106.83, just under the 107.045 midpoint, and the patient order misses the decline.
Stop. Above the Signal candle's high, the top of the failed gap. A close above it undoes the rejection the trade rests on. When the candle opens near its high, as here, the stop sits a full red body away from a close entry. That width is built in: the signal is a long red candle, so the risk is at least one long red candle.
Target. Target one is the green candle's open, target two the prior swing low. From either entry the first target is closer than the stop, and the definition guarantees it: the close lands in the lower half of the green body while the stop sits above the gap. Use the green open to bank part or tighten the stop; the swing low has to justify the trade.
What invalidates it
- A close above the Signal candle's high. Buyers have reclaimed the failed gap, everyone trapped at that open is in profit again, and the top the pattern pointed to has been rejected in turn.
- The red candle closed at or above the green body's midpoint. Taking back less than half of one strong day is too shallow to count; wait for more evidence instead of shorting a near miss.
- There was no gap. A red candle that opens at the prior close skips the failed breakout that gives the pattern its meaning, and what remains is an ordinary pullback candle.
- No real rally came first. After a decline or inside a flat range there is no stretched advance to reverse and no crowd of late buyers for the gap to trap.
Often confused with
Dark Cloud Cover vs Bearish Engulfing: what's the difference?
Watch where the red candle closes. In a dark cloud cover it stops inside the green body, below the midpoint but above the open; in a bearish engulfing it closes below the green open, covering the whole green body. The engulfing is the fuller rejection.
Dark Cloud Cover vs Evening Star: what's the difference?
A dark cloud cover is two candles: the red candle follows the long green one directly, opening above its high and closing below its midpoint. If a small stalling candle sits between the green and the red, it is an evening star instead.
Dark Cloud Cover vs Piercing Line: what's the difference?
Same structure, opposite ends of a move. A dark cloud cover tops a rally: a red candle opens above a long green candle's high and closes below its midpoint. A piercing line bottoms a decline: a green candle opens below a long red candle's low and closes above its midpoint.
How reliable is the dark cloud cover pattern?
The standard candlestick references present the dark cloud cover as a top-reversal warning and use penetration as its strength gauge: the deeper the red close cuts into the green body, the more it counts, and a close that falls short of the midpoint calls for more evidence before acting. It rates moderate here because results hinge on the ruleset. Definitions differ on whether the open must clear the prior high or only the prior close, how deep the close must reach and what counts as an uptrend, and each choice changes what is being measured. The gap rule also makes the strict version scarce outside markets that close overnight. It is a milder cousin of the bearish engulfing, which erases the whole green body. The chart's tidy decline is the textbook outcome, drawn to show the pattern working; a live one can just as easily stall at the green open or snap back above the gap. Its best feature is a nearby, unambiguous exit: a close above the Signal candle's high.
References
- Steve Nison. Japanese Candlestick Charting Techniques . Prentice Hall Press , 2001 . ISBN 978-0735201811.
- Thomas N. Bulkowski. Encyclopedia of Candlestick Charts . Wiley , 2008 . ISBN 978-0470182017.
Frequently asked questions
What does a dark cloud cover mean?
Is a dark cloud cover bullish or bearish?
How do you trade a dark cloud cover?
Does the dark cloud cover work in crypto and forex?
How reliable is the dark cloud cover?
Practise spotting the dark cloud cover
Reading about a pattern is not the same as recognising it under time pressure. Chart Guess drills 53 patterns as a 60-second game — read the chart, call BUY or SELL, get the pattern name instantly.