Hanging Man Candlestick Pattern
A hanging man is a single-candle bearish warning that forms after an advance: a small body near the top of the range, a lower wick at least twice the body's height and little or no upper wick, showing sellers drove price sharply lower mid-session before buyers hauled it back.
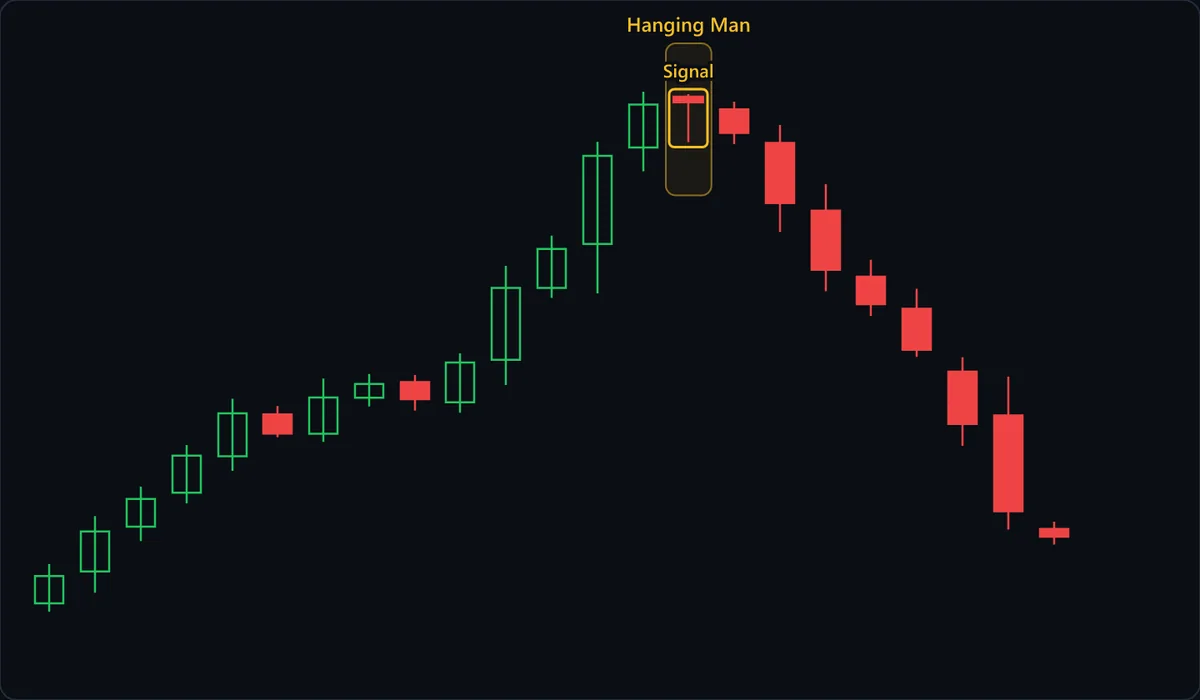
Chart data
| # | Open | High | Low | Close |
|---|---|---|---|---|
| 1 | 90.32 | 91.84 | 90 | 91.37 |
| 2 | 91.55 | 93.68 | 90.73 | 93.09 |
| 3 | 93.27 | 94.81 | 92.72 | 94.34 |
| 4 | 94.58 | 96.41 | 94.17 | 96 |
| 5 | 95.98 | 98.19 | 95.42 | 97.63 |
| 6 | 97.59 | 97.91 | 96.71 | 96.85 |
| 7 | 96.84 | 98.97 | 96.53 | 98.24 |
| 8 | 98.23 | 99.14 | 97.89 | 98.76 |
| 9 | 98.83 | 99.1 | 97.73 | 98.17 |
| 10 | 98.05 | 99.94 | 97.65 | 99.58 |
| 11 | 99.69 | 103.3 | 98.72 | 102.45 |
| 12 | 102.45 | 104.46 | 102.07 | 103.95 |
| 13 | 104.14 | 108.07 | 102.24 | 107.53 |
| 14 | 107.85 | 110 | 106.94 | 109.5 |
| 15 | 109.78 | 109.9 | 108.06 | 109.61 |
| 16 | 109.32 | 109.61 | 107.98 | 108.41 |
| 17 | 108.03 | 108.72 | 104.61 | 105.71 |
| 18 | 105.42 | 106.44 | 102.32 | 103.15 |
| 19 | 102.88 | 103.53 | 101.37 | 101.83 |
| 20 | 101.65 | 102.42 | 99.8 | 100.07 |
| 21 | 99.23 | 99.78 | 96.38 | 97.22 |
| 22 | 97.55 | 99.04 | 93.16 | 93.86 |
| 23 | 93.18 | 93.46 | 92.58 | 92.89 |
At a glance
| Type | Bearish reversal |
|---|---|
| Direction | Bearish |
| Bars required | 1 candle |
| Family | Candlestick pattern |
| Evidence | Weak |
| Also called | hanging man candle, hanging man candlestick, bearish hammer |
What timeframe does it work on?
Hanging men print on every timeframe, but the wick carries the most weight on daily and weekly charts, where it records a full session of selling absorbed near a rally's high. On one- and five-minute charts, rising markets throw off hammer shapes constantly as dips get bought inside the bar, so the shape alone says little there. Whatever the timeframe, the advance that qualifies it must show on that same chart: a 15-minute hanging man needs a 15-minute rally behind it.
Anatomy of the pattern
- The rally into it — Fourteen candles climb with only two small red pauses, and the last four steepen into the Hanging Man highlight. That advance is the precondition. It is what separates this candle from a hammer, and it supplies the late buyers who chased the steep final leg and are left holding the highest prices if the top holds.
- Long lower wick — The dangling legs behind the name: at least twice the body by convention, and many times it here. Sellers drove price well under the open mid-session, evidence that supply is now waiting at these prices, and buyers had to absorb all of it just to finish near where the candle began.
- Small body at the high (Signal) — The candle boxed as Signal squeezes its open and close into the top sliver of the range, with almost no upper wick. Its close is the highest of the whole advance, which is why it passes for strength at a glance. The body is red, closing under the open, which reads slightly more bearish; a green body still qualifies.
- Two reference prices — Everything that follows is measured from the candle's extremes. The low is the trigger: a close beneath it confirms that sellers came back for more. The high is the cancel line: a close above it means buyers absorbed the selling and kept going.
- The confirming close — The next candle opens below the body and closes red, yet its close stays above the hanging man's low, so the trigger has not fired. The long red candle after it is the first close below the low, and only from there does the chart show sellers following through.
How to identify it
- Price has been rising into the candle: a run of higher closes on the same timeframe, ideally an extended one. That advance is the only thing separating it from a hammer.
- The lower wick is at least twice the height of the body, and many traders insist on three times.
- The body sits in the top third of the range with little or no upper wick, so open and close both finish near the high. Either color counts; red is slightly more bearish.
- The body is small but visible. Open and close at one price make it a dragonfly doji, and long wicks on both ends make it a spinning top or high-wave candle.
- It prints at or beside the rally's high, ideally after an extended run or at a level that has capped price before.
- Before deciding anything, mark its low as the trigger and its high as the cancel level.
How to trade it
Entry. Sell after a candle closes below the hanging man's low. On its own the candle shows buyers winning the session; a close beneath its low shows sellers back and pushing past every price that session traded, leaving all of its buyers underwater. Here the next candle closes under the body but not the low, an earlier and weaker trigger some traders accept; the long red candle after it is the real one. Shorting the hanging man's own close is the classic mistake.
Stop. Above the hanging man's high. A close up there means buyers soaked up the session's selling and pushed on through the candle's top, which cancels the warning outright. Because the entry comes below the low and the stop sits above the high, the risk always exceeds the candle's full range; here it is more than twice that range, so shrink the position to fit that distance rather than tucking the stop inside the candle.
Target. Previous support or the start of the last leg up: here, the small sideways patch where the steep final four candles began. The hanging man suggests that last push ran out of buyers, and its base is where those buyers first committed. The candle implies no distance of its own, so check the target sits far enough below the entry to justify a stop already wider than the candle.
What invalidates it
- A close above the hanging man's high. Buyers absorbed the selling and closed above everything the session traded, so the warning is cancelled, not postponed.
- No real rally came before it. Mid-range there are no late buyers to trap, and after a decline the identical candle is a hammer, read the opposite way.
- The low holds and price turns back up. If following candles keep closing above the low, the wick was a dip that got bought, which strong uptrends do routinely.
- Long wicks on both ends. That is a two-way stalemate, a spinning top or high-wave candle, rather than a sell-off that buyers only just reversed.
Often confused with
Hanging Man vs Dragonfly Doji: what's the difference?
A hanging man has a small visible body and by definition follows an advance. A dragonfly after an advance is read the same way, as a bearish warning: location sets the meaning of both, and the body only sets the name.
Hanging Man vs Hammer: what's the difference?
Identical candle, opposite trend. After a decline, a small body atop a long lower wick is a hammer, bought on a close above its high; after an advance it is a hanging man, sold on a close below its low. Read the trend first: the candle alone cannot tell you which one you have.
Hanging Man vs Shooting Star: what's the difference?
Both are single-candle warnings after an advance, but the long wick points the other way. A shooting star's wick rises above a body near the low, so its close already shows buyers beaten; a hanging man's wick hangs below a body near the high, so its close still looks bullish.
Hanging Man vs Spinning Top: what's the difference?
Compare the wicks. A hanging man after an advance has a long lower wick and little or no upper wick, showing sellers specifically tested lower prices. A spinning top has wicks of similar length on both sides, so it shows hesitation without favoring either side.
How reliable is the hanging man pattern?
The hanging man is one of the weaker candles in the reversal canon, and the reason is printed on the candle itself: it closes near its high. On that session's own evidence buyers won, so the bearish case rests on the wick and on whatever comes next, which is why Nison's classic treatment insists on bearish confirmation before acting on one. It is rated weak here rather than context-dependent like its twin, the hammer. The hammer's close near the high agrees with its bullish reading, while the hanging man's close near the high argues against its bearish one, so even the right location does not make the candle strong alone. It earns more attention after a long, steep advance and at resistance that has turned price back before. Treat any published success rate with care: a test that waits for a close below the low is partly measuring that close, which is bearish in its own right, and results shift with the trend filter and wick ratio each study picks.
References
- Steve Nison. Japanese Candlestick Charting Techniques . Prentice Hall Press , 2001 . ISBN 978-0735201811.
- Thomas N. Bulkowski. Encyclopedia of Candlestick Charts . Wiley , 2008 . ISBN 978-0470182017.
Frequently asked questions
What does a hanging man candlestick mean?
Is a hanging man bullish or bearish?
How do you trade a hanging man?
Hanging Man vs Hammer: what is the difference?
How reliable is the hanging man?
Practise spotting the hanging man
Reading about a pattern is not the same as recognising it under time pressure. Chart Guess drills 53 patterns as a 60-second game — read the chart, call BUY or SELL, get the pattern name instantly.