Three Inside Down Candlestick Pattern
A three inside down is a three-candle bearish reversal at the top of a rally: a long green candle, a small red candle whose body fits inside it, then a red candle that closes below the first candle's open, undoing that candle's entire gain.
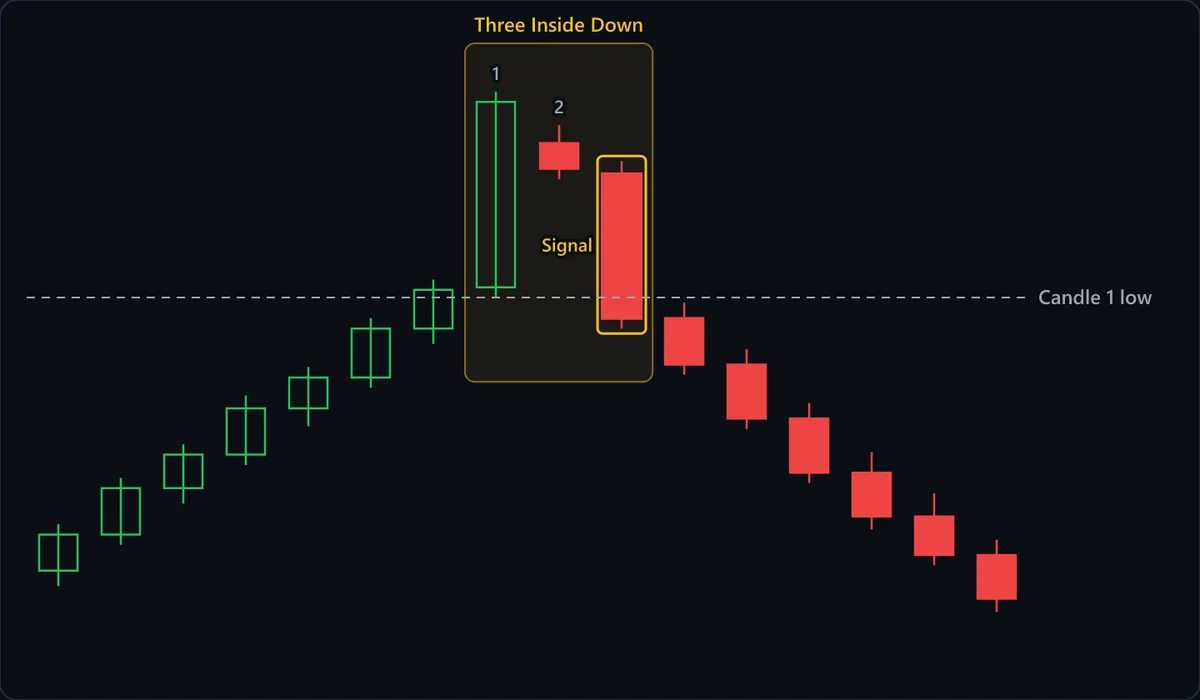
Chart data
| # | Open | High | Low | Close |
|---|---|---|---|---|
| 1 | 90 | 91.8 | 89.4 | 91.4 |
| 2 | 91.4 | 93.6 | 91 | 93.2 |
| 3 | 93.2 | 94.9 | 92.6 | 94.5 |
| 4 | 94.5 | 96.8 | 94.1 | 96.3 |
| 5 | 96.3 | 97.9 | 95.6 | 97.5 |
| 6 | 97.5 | 99.8 | 97.1 | 99.4 |
| 7 | 99.4 | 101.3 | 98.8 | 100.9 |
| 8 | 101 | 108.6 | 100.6 | 108.2 |
| 9 | 106.6 | 107.3 | 105.2 | 105.6 |
| 10 | 105.4 | 105.9 | 99.4 | 99.8 |
| 11 | 99.8 | 100.4 | 97.6 | 98 |
| 12 | 98 | 98.6 | 95.5 | 95.9 |
| 13 | 95.9 | 96.5 | 93.4 | 93.8 |
| 14 | 93.8 | 94.6 | 91.6 | 92.1 |
| 15 | 92.1 | 93 | 90.2 | 90.6 |
| 16 | 90.6 | 91.2 | 88.4 | 88.9 |
At a glance
| Type | Bearish reversal |
|---|---|
| Direction | Bearish |
| Bars required | 3 candles |
| Family | Candlestick pattern |
| Evidence | Moderate |
| Also called | three inside down candlestick, 3 inside down, confirmed bearish harami |
What timeframe does it work on?
On a daily chart each candle is a full session, so the stall and the reversal each took a day. On 1- and 5-minute charts a green, small red, red sequence appears in almost every pullback and means little. In crypto and forex candle 2 usually opens at the prior close, flush with the top of the green body; judge it by its close and size.
Anatomy of the pattern
- The rally into it — Seven green candles climb steadily before the box. A three inside down reverses buying that already happened; with no rally beneath it, the third candle has nothing to undo.
- 1: long green candle — The tallest candle on the chart, its body several times larger than any rally candle before it, with the high of the move at the top of its wick. Its open, low and high anchor the rest of the setup.
- 2: small red inside body — It opens below candle 1's close and closes in the upper half of the green body, so its whole body stays inside: a bearish harami. Buyers could not extend the high, but nothing has broken yet.
- Signal: the third close — The outlined red candle closes below candle 1's open, erasing the green candle's entire gain and leaving most of those who bought during it underwater. This close is the earliest moment the pattern exists.
- Candle 1 low line — The dashed line marks the bottom of candle 1's wick. The Signal candle closes beneath it too, the stricter form some traders require; a close between candle 1's open and this line still counts under the common rule.
- After the signal — Six red candles step lower and none trades back toward candle 2's body, so the rebound entry described below never arrived. This is a clean teaching example, not a typical or promised outcome.
How to identify it
- Price has been rising into the pattern, ideally an extended advance running into a level that has capped it before.
- Candle 1 is a long green candle, clearly larger than the rally candles behind it, that makes a new high for the move.
- Candle 2 is a small red candle whose open and close both fall within candle 1's body. Its wicks may stick out; the bodies define the harami.
- Candle 3 is red and closes below candle 1's open. A close below candle 1's low as well is the stricter version.
- Judge candle 3 only at its close. A dip under candle 1's open that recovers before the close leaves you with just a harami.
- The three candles are consecutive. If several sideways candles separate the harami from the drop, read it as a range breaking down instead.
How to trade it
Entry. Sell on the third candle's close, the first point where candle 2's stall has become a reversal of candle 1; selling the harami alone acts before anything has happened. The alternative is waiting for a rebound toward candle 2's body for a better price and shorter stop. In a fast breakdown like the one charted, that rebound never comes.
Stop. Above candle 1's high. The pattern claims that high ended the rally, so a move back above it means buyers have retaken everything the pattern said they lost. Because candle 1 is long, the stop sits far above a third-candle entry; answer that with the rebound entry or a smaller position, not a tighter stop inside the pattern.
Target. The nearest support below, or the previous swing low the rally started from. The three inside down measures no distance of its own. Before entering, compare the room down to that support with the distance up to the stop; with support just under the third candle's close, a valid pattern can still be a poor trade.
What invalidates it
- Price closes above candle 1's high. The rally has resumed through the very level the pattern said would cap it.
- Candle 3 closes at or above candle 1's open. That is a bearish harami with a weak follow-up, and shorting it is the mistake the third candle exists to prevent.
- There was no rally to reverse. In a sideways range, one green candle followed by two red ones traps nobody and means little.
- Candle 2's body reaches outside candle 1's body. A small body sitting wholly above the green close points toward an evening star; a red body covering the whole green body is a bearish engulfing, the start of a three outside down.
- It forms early in a strong uptrend with no resistance overhead, where it often yields only a shallow pullback that buyers absorb within a few candles.
Often confused with
Three Inside Down vs Evening Star: what's the difference?
Both put a small candle between a long green one and a red one. An evening star's middle candle sits at or above the top of the green body, often gapping up; a three inside down's middle body sits inside the green body, below its close.
Three Inside Down vs Three Black Crows: what's the difference?
Three inside down begins with a long green candle, then a small red body held inside it, then a red close below the first candle's open. Crows need all three candles long and red; a small middle candle tucked inside a green one is a harami setup instead.
Three Inside Down vs Three Outside Down: what's the difference?
Look at the middle candle. In a three inside down it is small and fits inside the green body, so the third candle does the reversing. In a three outside down it is a large red candle that engulfs the green body, so the reversal is made before the third candle arrives.
How reliable is the three inside down pattern?
The harami at the core of this pattern is a classic Japanese candlestick formation, and the confirmed three-candle version is catalogued in the modern candlestick references. Its strength is built in: a bare bearish harami says only that a rally has paused, and demanding a third close below the first candle's open screens out pauses that never turn. Its weakness is timing. By that close the whole green candle has been given back, so part of the drop is spent and the stop above candle 1's high is far away. Definitions also differ, requiring the third close below candle 1's open, below its low, or merely lower, and those choices change what any published test measured. That spread of rules, plus its habit of producing only a shallow dip inside a strong uptrend, is why it is rated moderate.
References
- Thomas N. Bulkowski. Encyclopedia of Candlestick Charts . Wiley , 2008 . ISBN 978-0470182017.
- Steve Nison. Japanese Candlestick Charting Techniques . Prentice Hall Press , 2001 . ISBN 978-0735201811.
Frequently asked questions
What does a three inside down mean?
Is a three inside down bullish or bearish?
How do you trade a three inside down?
Is a three inside down the same as a bearish harami?
How reliable is the three inside down?
Practise spotting the three inside down
Reading about a pattern is not the same as recognising it under time pressure. Chart Guess drills 53 patterns as a 60-second game — read the chart, call BUY or SELL, get the pattern name instantly.