Tweezer Top Candlestick Pattern
A tweezer top is a two-candle bearish reversal signal in which consecutive candles after a rally print matching or near-matching highs, usually a green candle followed by a red one, showing buyers rejected at the same price twice in a row.
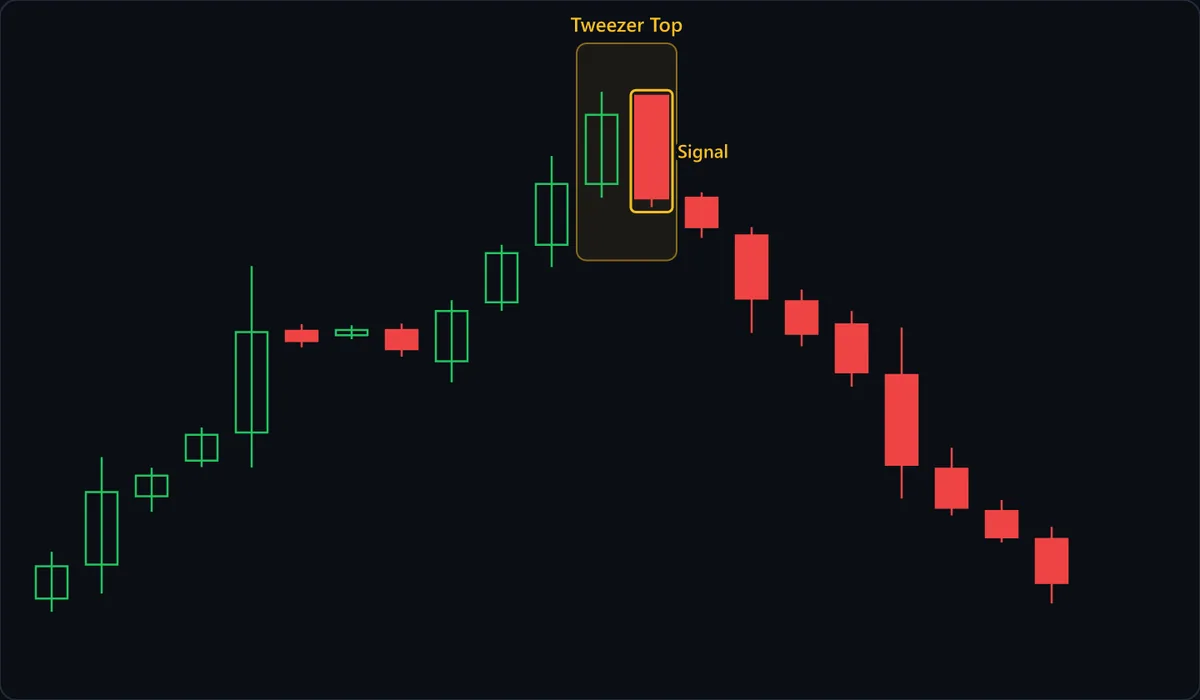
Chart data
| # | Open | High | Low | Close |
|---|---|---|---|---|
| 1 | 90.51 | 92.31 | 90 | 91.75 |
| 2 | 91.81 | 95.95 | 90.7 | 94.6 |
| 3 | 94.44 | 95.54 | 93.85 | 95.23 |
| 4 | 95.81 | 97.08 | 95.56 | 96.8 |
| 5 | 96.89 | 103.29 | 95.55 | 100.75 |
| 6 | 100.8 | 101.06 | 100.17 | 100.41 |
| 7 | 100.63 | 101.02 | 100.48 | 100.83 |
| 8 | 100.83 | 101.08 | 99.81 | 100.1 |
| 9 | 99.63 | 101.98 | 98.82 | 101.56 |
| 10 | 101.9 | 104.11 | 101.57 | 103.79 |
| 11 | 104.11 | 107.53 | 103.25 | 106.45 |
| 12 | 106.45 | 110 | 105.92 | 109.11 |
| 13 | 109.81 | 109.86 | 105.56 | 105.92 |
| 14 | 105.92 | 106.13 | 104.37 | 104.79 |
| 15 | 104.47 | 104.79 | 100.72 | 102.04 |
| 16 | 101.94 | 102.39 | 100.21 | 100.69 |
| 17 | 101.05 | 101.56 | 98.65 | 99.21 |
| 18 | 99.1 | 100.93 | 94.35 | 95.65 |
| 19 | 95.5 | 96.31 | 93.7 | 94 |
| 20 | 93.87 | 94.3 | 92.66 | 92.86 |
| 21 | 92.8 | 93.26 | 90.32 | 91.11 |
At a glance
| Type | Bearish reversal |
|---|---|
| Direction | Bearish |
| Bars required | 2 candles |
| Family | Candlestick pattern |
| Evidence | Context dependent |
| Also called | tweezer top candlestick, tweezer tops, tweezer top pattern |
What timeframe does it work on?
Tweezer tops turn up constantly on intraday charts, and there they are worth attention mainly when they line up with a level traders were already watching, such as a prior high or a round number. On one-minute and tick charts, equal highs are often just price rounding to the same tick, so they say very little. On daily charts the pattern means two full sessions were refused at one price, which is a heavier statement but gives a wider stop.
Anatomy of the pattern
- Prior advance — The pattern needs something to reverse. In the chart, price climbs, pauses in a cluster of small-bodied candles, then runs a second leg straight into the tweezer. Matching highs without that rally behind them are just a range top.
- First candle: the push — A green candle closes near its high and prints a fresh high for the move. On its own it looks like the rally is healthy, which is exactly why the next candle matters.
- Matching highs — The two highs line up at, or within a few ticks of, the same price. That precision is the whole message: buyers tested a specific level twice and found sellers waiting both times.
- Signal candle — The second candle opens near the first one's close, trades up to the same ceiling, then reverses and closes lower. In the chart it closes all the way down at the first candle's low, so it also engulfs the green body, which adds a second bearish signal at the same price.
- Confirmation close — The candle after the Signal closes below the Signal candle's low. Until that happens, the tweezer is a warning, not a trade.
How to identify it
- There is a visible rally into the two candles, or price is pressing into a resistance level that already mattered.
- Two adjacent candles share a high: identical, or close enough that the gap is small relative to the candles' ranges. If a third candle tags the same high, it reinforces the ceiling; the pattern itself is still the two adjacent candles.
- The classic sequence is a green candle followed by a red one; two red candles with matching highs qualify but say less.
- The second candle closes in the lower part of its range, showing the retest of the high was rejected rather than simply stalled.
- Extra weight if the second candle is itself a bearish engulfing or a shooting star, since then two signals agree at one price.
- The highs do not sit inside a sideways range that has been bouncing off the same level for many bars.
How to trade it
Entry. Sell on a close below the low of the second candle. The matching highs only show that buyers were stopped; the close below the second candle's low shows sellers taking ground back, and it filters out tweezers that merely pause before price breaks higher.
Stop. Just above the matching highs. That shared high is the level the whole pattern says sellers are defending; if price trades above it, the defence has failed and the reason for the trade is gone. A tall Signal candle makes this stop wide, which calls for a smaller position rather than a tighter stop.
Target. The nearest support below, or the start of the last rally. The tweezer marks where a leg up ran out, so the natural objective is where that leg began. In the chart, that is where the second leg began, at the cluster of small candles where the first rally paused.
What invalidates it
- Price closes above the tweezer highs. The ceiling the pattern was built on has given way.
- The matching highs sit inside a sideways range. Equal highs at the top of a range are the range doing its job, not a reversal of any trend.
- There was no meaningful rally before the two candles, so there is nothing for the pattern to reverse.
- No candle closes below the second candle's low and price drifts sideways under the highs. The signal never triggered; treat it as a stalled advance, not a short.
- The highs only match because of price rounding or a thin, low-volume session, rather than two real attempts to push through the level.
Often confused with
Tweezer Top vs Bearish Engulfing: what's the difference?
A bearish engulfing is defined by bodies: the red body must cover the prior green body. A tweezer top is defined by highs lining up, and the second body can be small. When both are true at once, as in the chart above, the signal is stronger than either alone.
Tweezer Top vs Tweezer Bottom: what's the difference?
The mirror image. A tweezer top lines up two highs after a rally and points down; a tweezer bottom lines up two lows after a decline and points up. Check which end of the candles matches and which way price was travelling.
How reliable is the tweezer top pattern?
Nison presents tweezers as minor reversal signals that gain importance when the second candle carries a bearish signal of its own, such as an engulfing or a shooting star, or when the matching highs land on established resistance. That is why the tier here is context-dependent: two candles touching the same high is an extremely common event, especially on intraday charts, and in a choppy market it means almost nothing. The shape becomes informative only after a real advance, at a level that already mattered, and once a later close breaks the second candle's low. Bulkowski catalogues tweezers among the candlestick patterns he tested.
References
- Steve Nison. Japanese Candlestick Charting Techniques . Prentice Hall Press , 2001 . ISBN 978-0735201811.
- Thomas N. Bulkowski. Encyclopedia of Candlestick Charts . Wiley , 2008 . ISBN 978-0470182017.
Frequently asked questions
What does a tweezer top mean?
Is a tweezer top bullish or bearish?
How do you trade a tweezer top?
Does a tweezer top need confirmation?
Do the highs of a tweezer top have to be exactly equal?
Practise spotting the tweezer top
Reading about a pattern is not the same as recognising it under time pressure. Chart Guess drills 53 patterns as a 60-second game — read the chart, call BUY or SELL, get the pattern name instantly.