Bearish Kicker Candlestick Pattern
A bearish kicker is a two-candle pattern in which a strong green candle with almost no wicks is followed by a gap down into a red marubozu that opens below the first candle's open and closes at its low, flipping control from buyers to sellers with no overlap between the two bodies.
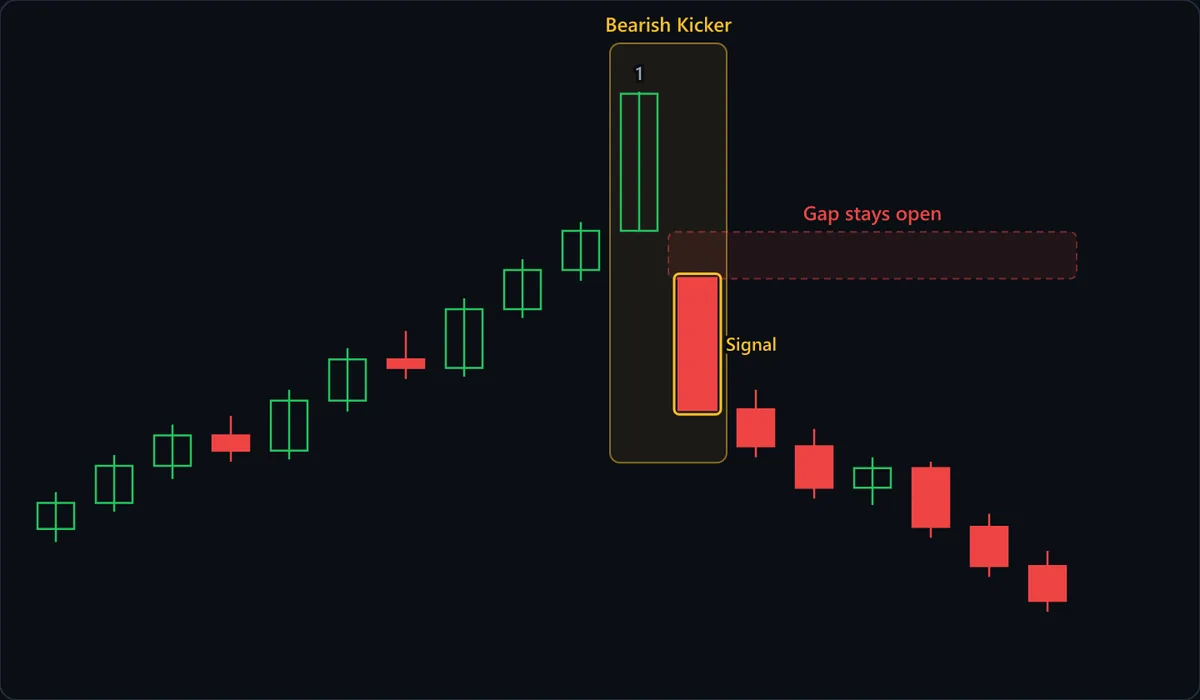
Chart data
| # | Open | High | Low | Close |
|---|---|---|---|---|
| 1 | 94 | 95.7 | 93.4 | 95.2 |
| 2 | 95.2 | 97.4 | 94.8 | 96.9 |
| 3 | 96.9 | 98.8 | 96.3 | 98.3 |
| 4 | 98.3 | 99.2 | 97.1 | 97.6 |
| 5 | 97.6 | 100.4 | 97.2 | 99.9 |
| 6 | 99.9 | 102.3 | 99.4 | 101.8 |
| 7 | 101.8 | 103.1 | 100.9 | 101.4 |
| 8 | 101.4 | 104.6 | 101 | 104.1 |
| 9 | 104.1 | 106.4 | 103.7 | 105.9 |
| 10 | 105.9 | 108.1 | 105.4 | 107.7 |
| 11 | 107.7 | 114.1 | 107.65 | 114 |
| 12 | 105.5 | 105.5 | 99.5 | 99.5 |
| 13 | 99.5 | 100.4 | 97.3 | 97.8 |
| 14 | 97.8 | 98.6 | 95.4 | 95.9 |
| 15 | 95.9 | 97.3 | 95.1 | 96.8 |
| 16 | 96.8 | 97.1 | 93.6 | 94.1 |
| 17 | 94.1 | 94.7 | 91.8 | 92.3 |
| 18 | 92.3 | 93 | 90.2 | 90.7 |
At a glance
| Type | Bearish reversal |
|---|---|
| Direction | Bearish |
| Bars required | 2 candles |
| Family | Candlestick pattern |
| Evidence | Moderate |
| Also called | bearish kicker candlestick, bearish kicking pattern, bearish kicker pattern |
What timeframe does it work on?
The kicker needs a real gap, so it lives where sessions break: daily charts of stocks and indices, usually around earnings or news. Markets that trade around the clock, like crypto and most forex hours, rarely gap between consecutive bars, so a strict kicker on an intraday crypto chart is close to impossible and a lookalike there is usually just one large red candle. Weekly charts can show it, but only when Monday opens below the prior week's open.
Anatomy of the pattern
- Candle 1 — A tall green candle with little or no wick at either end, closing at or near its high. It says buyers controlled the whole session, and it is the reason the reversal hurts: anyone who bought that close is now underwater from the first tick of the next session.
- The gap — The second session opens below candle 1's open, not merely below its close. That wipes out the entire previous session at the open, which is what separates a kicker from an ordinary weak open.
- Signal — A red marubozu: it opens at its high and closes at its low. No lower wick means buyers never managed a bounce into the close; no upper wick means the gap was never tested from below during the session.
- Gap stays open — The shaded band between the Signal candle's high and candle 1's low. While price stays under it, the longs from candle 1 have no exit near their entry, and their selling into any bounce is what the pattern's follow-through relies on.
How to identify it
- Candle 1 is green with a large body and almost no wicks, so it opens near its low and closes near its high.
- Candle 2 opens below candle 1's open. Opening below candle 1's close but still inside its body does not qualify.
- The two candles do not overlap at all: candle 2's high sits below candle 1's low, leaving a visible gap.
- Candle 2 is red, closes at or near its low, and has little or no wick on either end.
- Candle 2's body is large in its own right, not a small red candle that simply happened to open lower.
- The gap is genuine trading, not a dividend adjustment, a stock split or a futures contract roll on a continuous chart.
How to trade it
Entry. The app's guide sells on the close of the Signal candle, because the pattern is complete at that close and some kickers never bounce. The alternative is to wait for a weak bounce that stalls below the gap and sell as it fails, which gives a better price and a tighter stop but misses the cases that keep falling straight away.
Stop. Two logical places. Above the Signal candle's midpoint: a red marubozu that gets retraced by more than half has lost the conviction that defined it. Or above the gap, at candle 1's low: a move back into that zone frees the trapped longs and removes the premise. The midpoint stop is tighter and stops out more often; the gap stop is wider and needs a smaller position.
Target. The kicker implies no distance. Aim at the next support below, such as an earlier pullback low or the base the rally started from, and trail the stop down as the move develops. Exiting just because the move already looks extended is the mistake the app's guide flags, since the trapped buyers' selling can keep pressure on longer than it looks; let the trailing stop, not the size of the move, decide the exit.
What invalidates it
- Price closes back inside candle 1's range. The gap has filled, the trapped longs can get out, and the reversal of control the pattern described no longer holds.
- The Signal candle has real wicks or its body overlaps candle 1. That is a gap down or a bearish engulfing, and it should be judged by those rules instead.
- Candle 1 is not a strong green candle: a small body or a long upper wick means buyers were not in full control, so there is no conviction to reverse.
- The gap is an artifact of the data, such as an ex-dividend drop on an unadjusted chart or a roll between futures contracts.
- The bar after the signal closes above the Signal candle's midpoint, showing sellers could not hold even half of what they took.
Often confused with
Bearish Kicker vs Bearish Engulfing: what's the difference?
A bearish engulfing opens at or above candle 1's close and sells through its body, so the two candles overlap. A kicker opens below candle 1's open and never touches its body. Overlap means engulfing; a clean gap means kicker.
Bearish Kicker vs Bullish Kicker: what's the difference?
The exact mirror: a red marubozu followed by a gap up into a green marubozu. Check which way the gap points and which color comes second; the second candle's color is the direction of the signal.
Bearish Kicker vs Gap Down: what's the difference?
A gap down only needs the bar to trade entirely below the prior bar's low, leaving an untraded space. A bearish kicker also requires the prior bar to be a strong green marubozu and the gapped bar to be a red marubozu. A gap down after a red candle, or one with long wicks, is not a kicker.
How reliable is the bearish kicker pattern?
The kicker is often taught as one of the clearest two-candle signals, and the reasoning is structural: two full-range bodies in opposite directions with a gap between them leave no doubt about who controlled each session, which is why it is commonly taught as valid with or without a preceding uptrend, unlike a hammer or an engulfing, whose meaning depends on the trend before it. That teaching is traditional, not a tested result. It is rated moderate rather than well documented because the strict form is rare, so any published result rests on few examples, and because results shift with how strictly the marubozu and gap rules are applied. Loosen them and the sample fills with ordinary gap downs, which do not say the same thing.
References
- Thomas N. Bulkowski. Encyclopedia of Candlestick Charts . Wiley , 2008 . ISBN 978-0470182017.
Frequently asked questions
What does a bearish kicker mean?
Is a bearish kicker bullish or bearish?
Does a bearish kicker need confirmation?
What happens after a bearish kicker?
How reliable is the bearish kicker?
Practise spotting the bearish kicker
Reading about a pattern is not the same as recognising it under time pressure. Chart Guess drills 53 patterns as a 60-second game — read the chart, call BUY or SELL, get the pattern name instantly.