Bearish Engulfing Candlestick Pattern
A bearish engulfing is a two-candle reversal pattern at the top of a rally: a green candle is followed by a larger red candle that opens at or above the green close and closes below the green open, so the red body completely covers the green one.
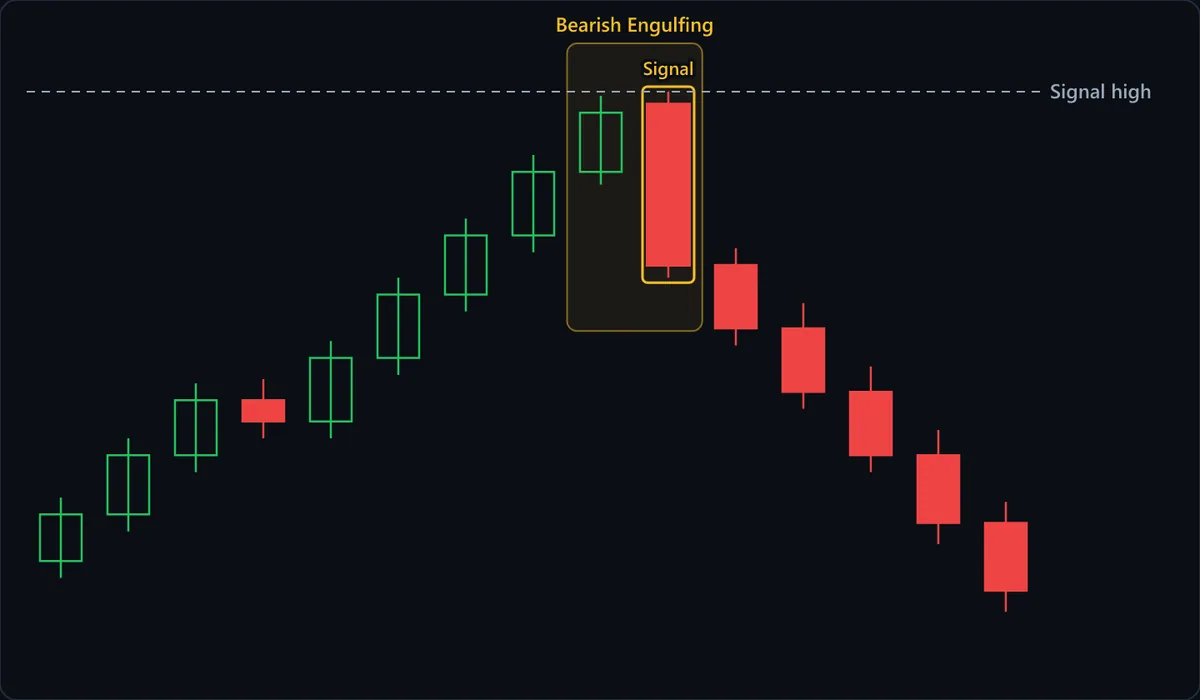
Chart data
| # | Open | High | Low | Close |
|---|---|---|---|---|
| 1 | 100 | 101.5 | 99.6 | 101.1 |
| 2 | 101.1 | 102.9 | 100.7 | 102.5 |
| 3 | 102.5 | 104.2 | 102.1 | 103.8 |
| 4 | 103.8 | 104.3 | 102.9 | 103.3 |
| 5 | 103.3 | 105.2 | 102.9 | 104.8 |
| 6 | 104.8 | 106.7 | 104.4 | 106.3 |
| 7 | 106.3 | 108.1 | 105.9 | 107.7 |
| 8 | 107.7 | 109.6 | 107.3 | 109.2 |
| 9 | 109.2 | 111 | 108.9 | 110.6 |
| 10 | 110.8 | 111.1 | 106.7 | 107 |
| 11 | 107 | 107.4 | 105.1 | 105.5 |
| 12 | 105.5 | 106.1 | 103.6 | 104 |
| 13 | 104 | 104.6 | 102.1 | 102.5 |
| 14 | 102.5 | 103.1 | 100.4 | 100.9 |
| 15 | 100.9 | 101.4 | 98.8 | 99.3 |
At a glance
| Type | Bearish reversal |
|---|---|
| Direction | Bearish |
| Bars required | 2 candles |
| Family | Candlestick pattern |
| Evidence | Moderate |
| Also called | bearish engulfing candle, bearish engulfing candlestick, bearish engulfing bar |
What timeframe does it work on?
The opening test behaves differently by market. On daily stock charts the red candle often gaps above the prior close, so buyers visibly start the session ahead and lose all of it. In crypto and most forex feeds a candle opens at the previous close, so the open condition is met automatically and only the close below the green open does any work; demand better location there. On one-minute charts the shape prints constantly, so on its own it carries little weight; location matters more there.
Anatomy of the pattern
- The rally into it — On the chart, eight candles climb with only one small red pause. The pattern needs that run of higher closes; without buyer control there is nothing to reverse.
- The green candle — The left candle in the Bearish Engulfing box is a modest green body, a normal-looking continuation of the climb. Its open is the line that matters, because everyone who bought anywhere inside that body is underwater once the next candle closes below it.
- Signal: the red candle — It opens slightly above the green close, so buyers start the session ahead, then sells off and closes well beneath the green open. Its body is more than twice the height of the green one. Its upper wick is short, and its lower wick is barely there, so the close sits near the low rather than recovering.
- Signal high — The dashed line marks the top of the red candle's upper wick, the highest price buyers reached before losing the session. It is the level the trade is built around: the stop goes above it, and a close back above it cancels the pattern.
- The follow-through — The five red candles after the Signal each close lower, and the first barely trades back into the red body. That is an outcome, not part of the definition.
How to identify it
- Price has been rising into the pair, or has just pushed into a resistance level, rather than chopping sideways.
- Candle 1 is green: its close is above its open.
- Candle 2 is red and opens at or above candle 1's close.
- Candle 2 closes below candle 1's open, so the whole green body sits inside the red body. Wicks do not count toward the test.
- The red body is clearly larger than the green one, not a near-equal pair of small candles.
- Stronger when the red candle has little or no upper wick and closes near its low. A long upper wick is allowed, but it shows a rally rejected inside the session and puts the stop further away.
How to trade it
Entry. Two entries are standard. Selling at the red candle's close acts as soon as the signal exists, at the cost of taking every failure. Waiting for a bounce into the red body gets a price closer to the stop, but a strong red candle may not bounce far, and in the charted example price trades only slightly back into the body, so an order placed deep in the red body can go unfilled.
Stop. Above the red candle's high, the Signal high line on the chart. That is the furthest buyers could push before sellers took over, so a trade above it means the takeover did not hold. A tall red candle makes this a wide stop when you sell at its close; reduce the position size rather than tucking the stop inside the candle.
Target. The nearest support or the previous swing low, and only if that level is at least twice your risk away. The pattern measures a change of control over one session, not a distance, so the target comes from the structure below. A support level sitting just under the red close makes the trade not worth taking.
What invalidates it
- A close above the red candle's high. The sellers who took the session have lost it back, and that is the app's own invalidation rule.
- There was no rally, or the pair formed mid-range. The shape still prints, but there is no buyer control for it to reverse.
- Both bodies are tiny. A small red candle covering a smaller green one is noise, the size mistake the app's guide warns about.
- The trend is strongly up with no resistance nearby. Selling into that on a single red candle is the guide's other listed mistake; a strong advance can absorb one red candle and keep going.
- The red close only reaches inside the green body instead of below its open. Then it is not an engulfing at all.
Often confused with
Bearish Engulfing vs Bearish Kicker: what's the difference?
A bearish engulfing opens at or above candle 1's close and sells through its body, so the two candles overlap. A kicker opens below candle 1's open and never touches its body. Overlap means engulfing; a clean gap means kicker.
Bearish Engulfing vs Dark Cloud Cover: what's the difference?
A dark cloud cover's red candle opens above the green candle's high and closes inside the green body, below its midpoint but above its open. A bearish engulfing only needs to open at or above the green close, and it closes below the green open.
Bearish Engulfing vs Three Outside Down: what's the difference?
A three outside down is a bearish engulfing plus a third candle that closes below the red candle's close. The first two candles are identical, so the difference is whether you act on the pair or wait one more bar for that lower close.
Bearish Engulfing vs Tweezer Top: what's the difference?
A tweezer top is defined by two candles with matching highs; nothing about the bodies is required. A bearish engulfing is defined by the red body covering the green body. A pair can be both, as the charted one nearly is, but each test has to be checked on its own.
How reliable is the bearish engulfing pattern?
The standard candlestick references treat the bearish engulfing as one of the classic two-candle reversals, the mirror of the bullish engulfing, which gets the same tier here. It is rated moderate rather than well documented because published results move a lot with the rules a test applies: whether the red open must be strictly above the green close, how large the red body must be, whether a prior rally is required and how it is measured, and whether entry is at the close or after a confirming lower close. Loose rules admit every small red candle in a range; strict ones leave few examples. The consistent message across the references is that location does the work: after an extended advance or at resistance it means something, and inside a choppy range very little.
References
- Steve Nison. Japanese Candlestick Charting Techniques . Prentice Hall Press , 2001 . ISBN 978-0735201811.
- Thomas N. Bulkowski. Encyclopedia of Candlestick Charts . Wiley , 2008 . ISBN 978-0470182017.
Frequently asked questions
What does a bearish engulfing mean?
Is a bearish engulfing bullish or bearish?
How do you trade a bearish engulfing?
Does a bearish engulfing need confirmation?
How reliable is the bearish engulfing?
Practise spotting the bearish engulfing
Reading about a pattern is not the same as recognising it under time pressure. Chart Guess drills 53 patterns as a 60-second game — read the chart, call BUY or SELL, get the pattern name instantly.