Three Black Crows Candlestick Pattern
Three black crows is a bearish reversal pattern of three consecutive long red candles after an advance, each opening inside the previous candle's body and closing at or near its low, showing sellers in control from open to close for three straight sessions.
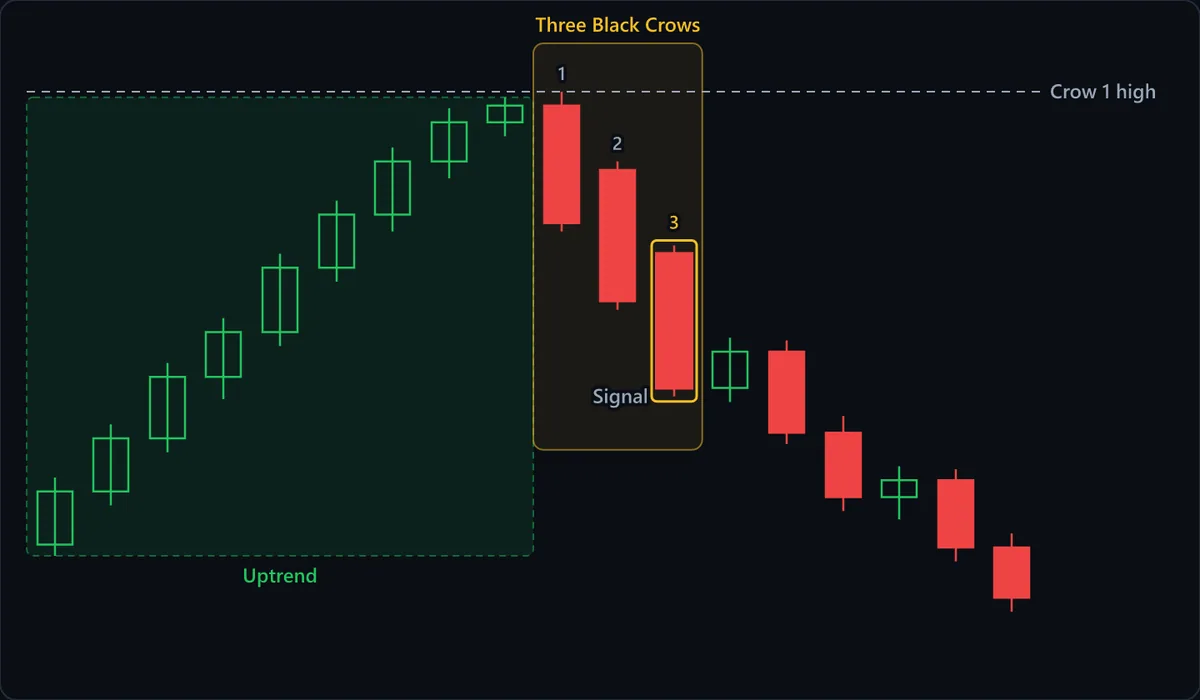
Chart data
| # | Open | High | Low | Close |
|---|---|---|---|---|
| 1 | 100 | 102.4 | 99.6 | 101.9 |
| 2 | 101.9 | 104.3 | 101.4 | 103.8 |
| 3 | 103.8 | 106.5 | 103.3 | 106 |
| 4 | 106 | 108.1 | 105.2 | 107.6 |
| 5 | 107.6 | 110.4 | 107.1 | 109.9 |
| 6 | 109.9 | 112.3 | 109.4 | 111.8 |
| 7 | 111.8 | 114.2 | 111.2 | 113.7 |
| 8 | 113.7 | 115.6 | 113.1 | 115.1 |
| 9 | 115.1 | 116 | 114.6 | 115.7 |
| 10 | 115.7 | 116.2 | 111.2 | 111.5 |
| 11 | 113.4 | 113.7 | 108.4 | 108.7 |
| 12 | 110.4 | 110.7 | 105.3 | 105.6 |
| 13 | 105.6 | 107.4 | 105.1 | 106.9 |
| 14 | 106.9 | 107.3 | 103.6 | 104 |
| 15 | 104 | 104.6 | 101.2 | 101.7 |
| 16 | 101.7 | 102.8 | 100.9 | 102.3 |
| 17 | 102.3 | 102.7 | 99.4 | 99.9 |
| 18 | 99.9 | 100.4 | 97.6 | 98.1 |
At a glance
| Type | Bearish reversal |
|---|---|
| Direction | Bearish |
| Bars required | 3 candles |
| Family | Candlestick pattern |
| Evidence | Moderate |
| Also called | 3 black crows, three black crows candlestick, three crows pattern |
What timeframe does it work on?
The pattern was defined on daily candles, where each crow is a full session of selling buyers could not reverse by the close. On intraday charts each bar usually opens at the previous close, so the open-inside-the-body test passes automatically and filters nothing. On any timeframe, crows must be long relative to recent candles, not merely red.
Anatomy of the pattern
- Uptrend — The shaded advance is what the crows reverse. Three long red candles read as a top only when a rally full of recent buyers sits above them; without one, the sequence is just another leg of an existing decline.
- Crow 1 — The first long red candle opens near the top of the advance and closes well down its range. Alone it is one bearish session. Its high, the dashed Crow 1 high line, is the level a recovery must reclaim to cancel the whole pattern.
- Crow 2 — Opens inside crow 1's body rather than above it, so buyers get only a modest lift at the open before it is sold. It closes at a new low near the bottom of its range, and its high becomes the reference for the stop.
- Crow 3 (Signal) — The third long red body repeats the sequence: an open within the prior body, a close at a fresh low, a short lower wick. The pattern completes on this close, which is also the point where price is most stretched from where the selling began.
- The bounce — The small green candle after crow 3 is the pause the app's entry waits for. A shallow relief move offers a better short price than the third crow's close and leaves a nearby high to place a stop above.
How to identify it
- Three consecutive red candles, each with a long body compared with the candles before it. Three small red bars in a row do not qualify.
- Crows 2 and 3 each open within the real body of the previous crow: no higher than its open and no lower than its close.
- Each crow closes at a new low, at or near the bottom of its own range, so the lower wicks are short or absent.
- The bodies are of broadly similar size. A third crow much smaller than the first two, or one with a long lower wick, says the selling is already tiring.
- The sequence follows a visible rally or sits at a prior top, so there are recent buyers above who are now losing money.
How to trade it
Entry. Sell a bounce after the third crow, or sell a break below the third crow's low if the bounce is shallow. The reason is location: by crow 3's close price has already dropped three long candles, so shorting that close sells the most stretched point of the move. Waiting for relief, like the green candle in the chart, buys a better price and a defined high to lean against.
Stop. Above the second crow's high, or above the bounce high if you sold the bounce. Crow 2's high sits above the last two lower opens, so a recovery through it erases the middle of the pattern and breaks the chain of lower opens and lower closes. The bounce high is tighter but easier to clip; size the position to whichever level you use.
Target. The pattern implies no distance. Use the nearest support below, and in a fresh reversal from a top, the prior swing low where the rally began. Those are the levels where buyers who missed the advance are most likely to step in, so they are where the decline is most likely to stall.
What invalidates it
- A bullish engulfing candle swallows the third crow's body. Buyers have reclaimed a full session of selling in one bar, which undercuts the claim that sellers are in control.
- Price closes back above crow 1's high, the dashed line on the chart. The entire three-session decline has been recovered and there is no reversal left to trade.
- The three red candles arrive after a long, steep decline rather than a rally. Late in a selloff, three big red bodies can be capitulation that marks a low, not the start of a new downtrend.
- The bodies are short or shrinking and the lower wicks are long. That is buyers absorbing the selling into each close, which describes fading pressure rather than three crows.
Often confused with
Three Black Crows vs Three Inside Down: what's the difference?
Three inside down begins with a long green candle, then a small red body held inside it, then a red close below the first candle's open. Crows need all three candles long and red; a small middle candle tucked inside a green one is a harami setup instead.
Three Black Crows vs Three Outside Down: what's the difference?
Three outside down starts with a green candle that the second, red candle fully engulfs, then a third closes lower. Three black crows contains no green candle and no engulfing: every crow opens inside the previous red body.
Three Black Crows vs Three White Soldiers: what's the difference?
The mirror image: three long green candles after a decline, each opening inside the prior body and closing near its high. Same construction rules, opposite colour and location; soldiers climb from a low, crows step down from a high.
How reliable is the three black crows pattern?
Three black crows sits in the moderate tier because its rules are more objective than most candlestick signals, yet the standard references differ on how strictly to apply them, and results move with those choices. How long must a body be? Must each open fall inside the prior body? How large a prior advance is required? Each answer changes which sequences qualify. The pattern also carries a timing cost: it completes only after three strong down sessions, so much of the initial drop may be gone at the signal, and relief bounces from that stretched point are common. Location matters as much as shape, since the same candles after an extended decline are often read as capitulation. Treat it as evidence that selling has taken control, not as a forecast.
References
- Thomas N. Bulkowski. Encyclopedia of Candlestick Charts . Wiley , 2008 . ISBN 978-0470182017.
- John J. Murphy. Technical Analysis of the Financial Markets . New York Institute of Finance , 1999 . ISBN 978-0735200661.
Frequently asked questions
What does three black crows mean?
Is three black crows bullish or bearish?
How do you trade three black crows?
What happens after three black crows?
How reliable is the three black crows pattern?
Practise spotting the three black crows
Reading about a pattern is not the same as recognising it under time pressure. Chart Guess drills 53 patterns as a 60-second game — read the chart, call BUY or SELL, get the pattern name instantly.