Gap Down Pattern (Falling Window)
A gap down is a break in the chart where a candle's high stays below the previous candle's low, so a band of prices goes untraded overhead, usually because bad news or heavy selling while the market was closed repriced it at the open.
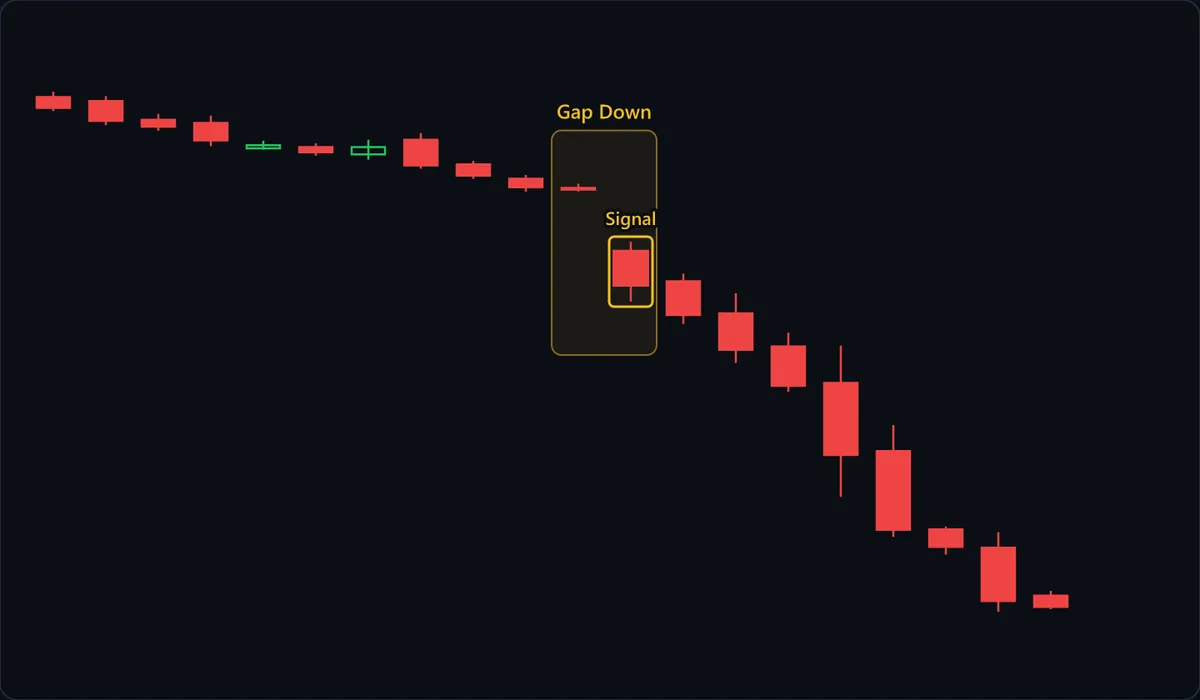
Chart data
| # | Open | High | Low | Close |
|---|---|---|---|---|
| 1 | 109.79 | 110 | 109.25 | 109.37 |
| 2 | 109.64 | 109.83 | 108.71 | 108.88 |
| 3 | 108.92 | 109.14 | 108.49 | 108.65 |
| 4 | 108.8 | 109.08 | 107.9 | 108.12 |
| 5 | 107.82 | 108.11 | 107.76 | 107.94 |
| 6 | 107.87 | 108.01 | 107.54 | 107.67 |
| 7 | 107.59 | 108.15 | 107.39 | 107.87 |
| 8 | 108.15 | 108.4 | 107.03 | 107.16 |
| 9 | 107.2 | 107.34 | 106.65 | 106.77 |
| 10 | 106.65 | 106.79 | 106.15 | 106.32 |
| 11 | 106.3 | 106.46 | 106.16 | 106.25 |
| 12 | 103.85 | 104.23 | 101.92 | 102.56 |
| 13 | 102.71 | 103 | 101.06 | 101.41 |
| 14 | 101.47 | 102.25 | 99.57 | 100.07 |
| 15 | 100.2 | 100.73 | 98.46 | 98.69 |
| 16 | 98.8 | 100.23 | 94.42 | 96.03 |
| 17 | 96.18 | 97.18 | 92.88 | 93.15 |
| 18 | 93.17 | 93.28 | 92.2 | 92.49 |
| 19 | 92.46 | 93.06 | 90 | 90.41 |
| 20 | 90.62 | 90.8 | 90.1 | 90.19 |
At a glance
| Type | Continuation |
|---|---|
| Direction | With the trend |
| Bars required | 2 candles |
| Family | Chart pattern |
| Evidence | Context dependent |
| Also called | gap down pattern, falling window, downside gap, bearish gap |
What timeframe does it work on?
A gap down needs a pause in trading for selling to pile up, so the meaningful ones appear on daily and weekly stock and index charts after an earnings miss, a downgrade or an overnight shock. Intraday, real gaps are mostly limited to the session's opening bar and to the first bar after a trading halt. Forex gaps mostly at the Sunday open, nonstop crypto rarely gaps, and gaps between one-minute bars in a thin market are holes in the order book, not a signal.
Anatomy of the pattern
- The slow drift lower — Small overlapping candles slide gently down, with a couple of green bars mixed in. A gap out of a quiet, sagging range like this accelerates a move that had barely started; the same gap at the bottom of a long, steep slide is where exhaustion flushes happen.
- The empty space — Inside the Gap Down highlight, nothing trades between the last pre-gap candle's low and the Signal candle's high. Everyone who bought above that band is underwater with no prices in between to exit at, and many will sell any rally back toward their entry. That overhead supply makes the band a ceiling.
- The Signal candle — The gap candle opens far below the prior low and closes red in the lower part of its range, so sellers kept pressing after the open. Its high anchors the stop; its low is the breakdown trigger. Volume is the key confirmation on a gap down, and this chart does not show it.
- The candles that follow — They classify the gap. The next candle stays under the Signal high and closes below the Signal low. The gap is holding, which is breakaway or runaway behavior, and that close is the breakdown entry. No bounce ever reaches the gap, so the rejected-bounce entry never appears here.
How to identify it
- The gap candle's high is below the previous candle's low, with no overlap. An open below yesterday's close that trades back into yesterday's range leaves no gap on the chart.
- The drop is large next to the candles before it. A sliver of a gap inside a sideways range is a common gap, which usually fills and means little.
- You can name where it started: a distribution top or quiet range (breakaway candidate), partway through a decline (runaway), or after a long, steep selloff (exhaustion candidate).
- Volume on the gap candle clearly exceeds the recent average. A breakaway gap down from a top on light volume is suspect.
- In the next few sessions price fails to get back above the gap candle's high. That failure confirms the gap; an immediate rally back through it marks a common gap or, after a long, steep decline, an exhaustion gap.
How to trade it
Entry. Not at the open: shorting the first print sells into where snapback rallies start. Either sell a bounce that pokes into the lower part of the gap and gets rejected, closing back below the gap candle's high, or sell a break below the gap candle's low. The bounce gives a better price but may never come, as on this chart; the breakdown costs distance but proves sellers are still in control.
Stop. Above the gap candle's high, judged on a close. A close there puts price back inside the empty space and opens the way to a full fill; Nison treats a close above the window's top, the pre-gap candle's low, as the bearish signal clearly over. If you sold a bounce that wicked into the gap, still exit on that close. A resting order above the bounce's high caps intraday risk, and the pre-gap low is the outer limit.
Target. Project the height of the top or range the gap broke away from downward from its bottom, the measured move, unless a prior swing low or other support is nearer. A runaway gap mid-decline has no top of its own; the classic references call it a measuring gap that often forms near the move's halfway point. For a runaway gap, measure from where the decline began down to the gap and project that same distance below the gap. Treat it as a rough projection, not a promise.
What invalidates it
- A close above the gap candle's high. Price is back inside the empty space, trapped longs are getting their exit, and the gap is on its way to filling.
- The gap candle rallies from the open and closes near its high. The gap is still open, but buyers absorbed the selling, which is how already-priced-in bad news tends to look.
- It arrives after a long, steep decline. That is exhaustion territory, the last holders capitulating at once, and the gap is more likely to mark a low than start a new leg down.
Often confused with
Gap Down vs Bearish Kicker: what's the difference?
A bearish kicker is a reversal off a strong green candle: the next candle opens at or below its open and runs lower as a strong red body. Its gap is open to open, so shadows may overlap. A plain gap down needs the new candle's high below the prior low, whatever the candles look like.
Gap Down vs Gap Up: what's the difference?
Mirror images. A gap down leaves untraded prices above the gap candle's high, where they act as resistance; a gap up leaves them below the gap candle's low as support. A close back into the gap fails either one.
Gap Down vs Island Reversal: what's the difference?
A gap down that follows a gap up a few candles before can strand those candles as an island top. Before reading a gap down as continuation, check for an opposing gap on its left at about the same price after an advance. If so, it is an island top, a reversal setup rather than continuation.
How reliable is the gap down pattern?
Its reliability depends on context. Edwards and Magee and Murphy divide gaps into common, breakaway, runaway and exhaustion types, and Nison treats the falling window as a bearish continuation signal whose top edge becomes resistance. Those types imply opposite things: breakaway and runaway gaps start or extend a decline, while an exhaustion gap after a long slide often marks its low, and the gap candle can look identical in each. Location gives the first read and the next few sessions confirm it. In its favor, both the pattern and its failure are objective: a band of prices either went untraded or it did not, and price either closes above the gap candle's high or it does not.
References
- Robert D. Edwards, John Magee and W.H.C. Bassetti. Technical Analysis of Stock Trends . Routledge , 2018 . ISBN 978-1138069411.
- John J. Murphy. Technical Analysis of the Financial Markets . New York Institute of Finance , 1999 . ISBN 978-0735200661.
- Steve Nison. Japanese Candlestick Charting Techniques . Prentice Hall Press , 2001 . ISBN 978-0735201811.
Frequently asked questions
What does a gap down mean?
Is a gap down bullish or bearish?
How do you trade a gap down?
What happens after a gap down?
Should you buy a stock after it gaps down?
Practise spotting the gap down
Reading about a pattern is not the same as recognising it under time pressure. Chart Guess drills 53 patterns as a 60-second game — read the chart, call BUY or SELL, get the pattern name instantly.