Descending Channel Pattern
A descending channel is a downtrend contained between two parallel falling lines: an upper rail joining successive lower highs and a lower rail joining successive lower lows, with price swinging between them until a close beyond one rail ends the structure.
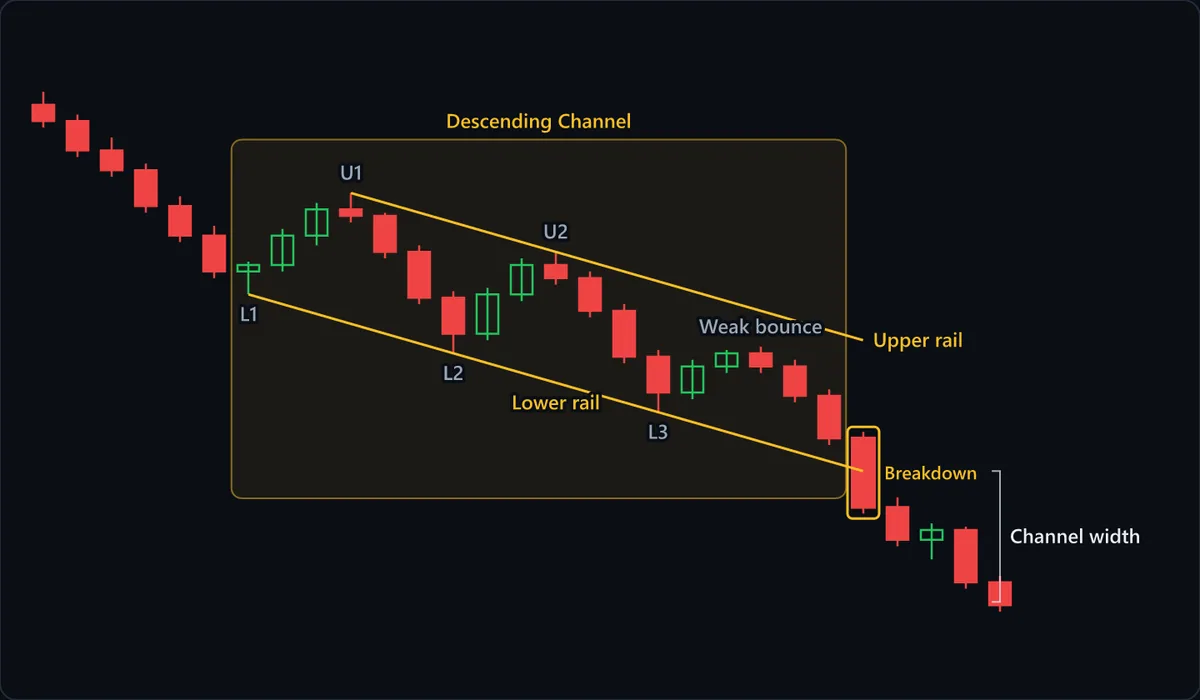
Chart data
| # | Open | High | Low | Close |
|---|---|---|---|---|
| 1 | 127.6 | 128.4 | 126.2 | 126.6 |
| 2 | 126.6 | 127 | 124.4 | 124.8 |
| 3 | 124.8 | 125.6 | 123.2 | 123.6 |
| 4 | 123.6 | 124 | 121 | 121.4 |
| 5 | 121.4 | 122 | 119.2 | 119.6 |
| 6 | 119.6 | 120.2 | 117 | 117.4 |
| 7 | 117.4 | 118 | 116 | 117.8 |
| 8 | 117.8 | 120 | 117.4 | 119.6 |
| 9 | 119.6 | 121.6 | 119 | 121.2 |
| 10 | 121.2 | 122.2 | 120.4 | 120.8 |
| 11 | 120.8 | 121 | 118.2 | 118.6 |
| 12 | 118.6 | 119 | 115.4 | 115.8 |
| 13 | 115.8 | 116.2 | 112.4 | 113.6 |
| 14 | 113.6 | 116.4 | 113.2 | 116 |
| 15 | 116 | 118.2 | 115.6 | 117.8 |
| 16 | 117.8 | 118.6 | 116.6 | 117 |
| 17 | 117 | 117.4 | 114.6 | 115 |
| 18 | 115 | 115.4 | 111.8 | 112.2 |
| 19 | 112.2 | 112.6 | 108.8 | 110 |
| 20 | 110 | 112 | 109.6 | 111.6 |
| 21 | 111.6 | 112.6 | 111.2 | 112.4 |
| 22 | 112.4 | 112.8 | 111.2 | 111.6 |
| 23 | 111.6 | 112 | 109.4 | 109.8 |
| 24 | 109.8 | 110.2 | 106.8 | 107.2 |
| 25 | 107.2 | 107.6 | 102.6 | 103 |
| 26 | 103 | 103.6 | 100.6 | 101 |
| 27 | 101 | 102 | 99.8 | 101.6 |
| 28 | 101.6 | 101.8 | 98 | 98.4 |
| 29 | 98.4 | 98.8 | 96.6 | 97 |
At a glance
| Type | Continuation |
|---|---|
| Direction | With the trend |
| Bars required | Multiple bars |
| Family | Chart pattern |
| Evidence | Moderate |
| Also called | falling channel, downward channel, descending price channel, bearish channel pattern |
What timeframe does it work on?
A channel needs at least two touches on each rail, so it spans far more bars than a candlestick signal and on daily charts can run for months. On intraday charts a falling channel is often just a pullback inside the trend of the timeframe above, and that higher trend decides which side to trade: inside a larger uptrend, it often behaves like a bull flag and resolves upward.
Anatomy of the pattern
- Upper rail (U1, U2) — The line through successive lower highs. Each rejection here is a rally sellers met at a lower price than the last, and this rail is where the with-trend short is planned.
- Lower rail (L1, L2, L3) — Drawn parallel to the upper rail through the swing lows. It marks where dip-buyers have repeatedly lifted price, which is why it is the target for a short from the top rail.
- Weak bounce — A rally that stalls well below the upper rail tells you sellers are arriving early. It is the bearish tell; the opposite tell, a decline that holds above the lower rail, is the warning that sellers are tiring.
- Breakdown — A close below the lower rail shows dip-buyers did not appear at their usual level and suggests the decline is accelerating rather than ending, though a break that is quickly reclaimed can mark a selling climax instead. A wick through the rail that closes back inside does not count.
- Channel width — The vertical distance between the rails at the break. Projected beyond the broken rail, it is the conventional yardstick for the move out of the channel, not a forecast.
How to identify it
- Price prints a sequence of lower highs and lower lows, not a single sharp drop.
- At least two highs line up on a falling upper rail and at least two lows on a falling lower rail; a third touch on either side makes the drawing more convincing.
- The rails are parallel. If the lower rail flattens and the lines converge, you are looking at a falling wedge; if they spread apart, it is a broadening structure.
- Swings travel most of the way across the channel. Rallies that keep stalling short of the upper rail suggest sellers are in control; lows that stop reaching the lower rail warn that they are tiring.
- The higher-timeframe trend is checked before choosing a side, because it decides whether the channel is a trend to sell or a pullback to buy.
How to trade it
Entry. The with-trend trade is a short near the upper rail once a bearish candle confirms the rejection there. Selling the line blindly assumes it will hold; waiting for the candle gives up a little price for evidence that sellers defended the lower high. A second with-trend option is a short on a close below the lower rail, as in the chart, with the stop back inside the channel above the breakdown candle. The advanced alternative is a long on a close above the upper rail.
Stop. Above the upper rail for shorts, beyond the high of the rejection candle. The rail is the whole thesis, a series of lower highs, so a close above it means the thesis failed. Because the rail slopes down, the logical stop drops a little every bar, which lets traders trail it with the structure.
Target. For a short from the upper rail, the lower rail: the level where buyers have lifted price on every earlier visit, and a moving target that drops the longer the trade lasts. For a breakdown short, the channel width projected below the broken lower rail is the conventional yardstick, as the chart shows; for a long on a break above, project it upward.
What invalidates it
- A close above the upper rail. The lower-high sequence is broken, and the signal is stronger when the preceding decline failed to reach the lower rail first.
- Downswings keep falling short of the lower rail. Shrinking declines show sellers losing force and often precede a break upward, so the next short at the top rail deserves less confidence.
- The rails stop being parallel. A lower rail that flattens toward the upper one turns the structure into a falling wedge, whose conventional lean is bullish.
- One rail has a single touch. That is a trendline plus a guess, and the target on the opposite rail is invented.
- The higher-timeframe trend is up. A falling channel inside a larger advance is usually a pullback, and repeatedly selling its upper rail fights the bigger move.
Often confused with
Descending Channel vs Ascending Channel: what's the difference?
The mirror image. An ascending channel rises through higher highs and higher lows, and its with-trend trade is a long off the lower rail; a descending channel's is a short off the upper rail.
Descending Channel vs Bull Flag: what's the difference?
A bull flag is a short, falling channel that follows a steep advance. Look left: if the drift lower comes straight after a sharp rally and lasts fewer bars than that rally, read it as a bull flag, not as a downtrend to sell.
Descending Channel vs Bullish Wolfe Wave: what's the difference?
A descending channel has roughly parallel boundaries, so a close below the lower line is a breakdown. A bullish Wolfe wave needs the 2-4 line falling faster than the 1-3 line, so the range narrows before point 5 dips briefly under it.
Descending Channel vs Falling Wedge: what's the difference?
Both slope down, but a descending channel's rails stay parallel while a falling wedge's lower line falls more slowly, so the two converge. Converging lines mean shrinking downswings and a bullish lean; parallel rails mean the decline is keeping its pace.
How reliable is the descending channel pattern?
Channels appear in the standard chart-pattern references and in general technical-analysis texts as a basic trend tool. The tier is moderate rather than well documented because a channel is drawn, not measured: both rails are sloped, the trader picks which swing points to connect, and the second rail is often a parallel copy of the first, so two people can draw the same decline with different breakout levels. The channel also has no fixed exit direction; inside an uptrend it often behaves like a bull flag. Its strength is a clear failure point: a close above the upper rail ends the lower-high sequence. Results depend on how the rails are defined, so no success rate is quoted here.
References
- Thomas N. Bulkowski. Encyclopedia of Chart Patterns . Wiley , 2005 . ISBN 978-0471668268.
- John J. Murphy. Technical Analysis of the Financial Markets . New York Institute of Finance , 1999 . ISBN 978-0735200661.
Frequently asked questions
What does a descending channel mean?
Is a descending channel bullish or bearish?
How do you trade a descending channel?
What happens when price breaks out of a descending channel?
How reliable is the descending channel?
Practise spotting the descending channel
Reading about a pattern is not the same as recognising it under time pressure. Chart Guess drills 53 patterns as a 60-second game — read the chart, call BUY or SELL, get the pattern name instantly.