Bull Flag Pattern
A bull flag is a continuation pattern in which a sharp advance — the flagpole — is followed by a shallow, orderly consolidation that drifts sideways or slightly lower, before price breaks out and resumes the original direction.
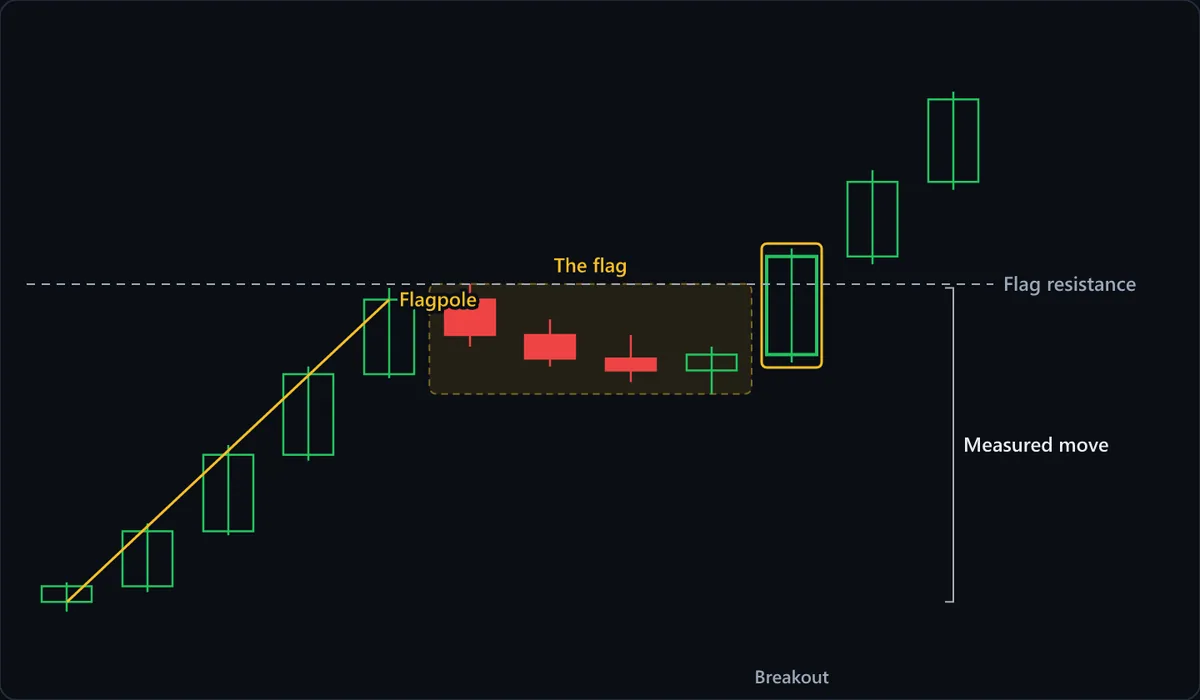
Chart data
| # | Open | High | Low | Close |
|---|---|---|---|---|
| 1 | 100 | 101 | 99.5 | 100.8 |
| 2 | 100.8 | 104 | 100.5 | 103.6 |
| 3 | 103.6 | 108 | 103.4 | 107.5 |
| 4 | 107.5 | 112 | 107.2 | 111.6 |
| 5 | 111.6 | 116 | 111.4 | 115.4 |
| 6 | 115.4 | 116.2 | 113 | 113.6 |
| 7 | 113.6 | 114.4 | 112 | 112.4 |
| 8 | 112.4 | 113.6 | 111.2 | 111.8 |
| 9 | 111.8 | 113 | 110.6 | 112.6 |
| 10 | 112.6 | 118 | 112.2 | 117.6 |
| 11 | 117.6 | 122 | 117.2 | 121.4 |
| 12 | 121.4 | 126 | 121 | 125.6 |
At a glance
| Type | Continuation |
|---|---|
| Direction | With the trend |
| Bars required | Multiple bars |
| Family | Chart pattern |
| Evidence | Well documented |
| Also called | bull flag pattern, flag pattern, bullish flag |
What timeframe does it work on?
Bull flags form on all timeframes and are one of the more scale-invariant patterns, which is why they are popular with both intraday and swing traders. What has to scale with the timeframe is the duration limit: a flag that consolidates for a few bars on a 5-minute chart is analogous to one lasting a few weeks on a daily. A consolidation that persists for much longer than the flagpole took to form has stopped being a flag.
Anatomy of the pattern
- The flagpole — A steep, largely uninterrupted advance. Its steepness matters: the pattern's logic is that a strong impulse leaves buyers who missed it waiting to enter on any pause, and a gentle rise does not create that pressure.
- The flag — A tight consolidation drifting sideways or slightly against the trend, ideally between two roughly parallel lines. It should be shallow relative to the flagpole — a deep pullback is a different pattern with different odds.
- Contracting range and falling volume — In a healthy flag, candle ranges narrow and volume dries up through the consolidation. That combination says sellers are not pressing, only that buyers are pausing.
- The breakout — Price closes above the flag's upper boundary, ideally on expanding volume. The close matters more than the intraday poke: wicks through resistance that close back inside are the most common source of failed flag trades.
- The measured move — The conventional target projects the flagpole's height upward from the breakout point. It is a convention rather than a law, but it gives a defensible reference in a pattern that otherwise implies no distance.
How to identify it
- A clear, steep advance precedes the consolidation — you can point at the flagpole.
- The consolidation is shallow relative to the flagpole, typically retracing no more than about a third to a half of it.
- The flag's boundaries are roughly parallel, drifting sideways or gently downward rather than accelerating lower.
- Candle ranges contract and volume declines through the consolidation.
- The flag lasts a shorter time than the flagpole took to form.
- The breakout is a close above the flag's upper boundary, not merely a wick through it.
How to trade it
Entry. The standard entry is a close above the flag's upper boundary. Some traders anticipate by entering inside the flag near its lower boundary, which offers a better price and a tighter stop but risks entering a consolidation that turns into a reversal. Requiring the breakout close forgoes some of the move in exchange for skipping the flags that never break out.
Stop. Below the flag's low. That level is the pattern's premise — the deepest point sellers reached during the pause — so a close beneath it means the consolidation was not a pause after all. Placing the stop under the flagpole's base instead is technically safer but usually makes the risk-reward indefensible.
Target. The measured move: add the flagpole's height to the breakout price. Treat it as a reference rather than a promise, and check what sits between entry and target — a prior swing high or round number partway there will often stop the move regardless of what the projection says.
What invalidates it
- The consolidation is too deep. A pullback retracing most of the flagpole is not a flag; it signals that the impulse has been substantially rejected, and the continuation odds fall accordingly.
- The flag lasts longer than the flagpole. Extended consolidation drains the urgency the pattern depends on, and long ranges resolve in either direction far more evenly.
- The flag drifts upward instead of sideways or down. A consolidation angling with the trend gives buyers who missed the move no better price, and tends to resolve less reliably.
- The breakout occurs on falling volume and immediately closes back inside the flag. That is a failed breakout, and it frequently precedes a move in the opposite direction.
- There was no real flagpole. Drawing a flag on a modest rise is the most common way this pattern gets misapplied — without a genuine impulse there is nothing to continue.
Often confused with
Bull Flag vs Ascending Channel: what's the difference?
A bull flag's consolidation drifts sideways or down, against the trend, and lasts only briefly after a steep flagpole. An ascending channel slopes up, with the trend, and can run for many swings. Parallel lines pointing upward with no pole beneath them make a channel, not a flag.
Bull Flag vs Ascending Triangle: what's the difference?
An ascending triangle narrows between a flat ceiling and rising support over many bars. No flat ceiling being repeatedly tested means it is not an ascending triangle; a steep pole followed by a short parallel channel, usually sloping slightly down, is what makes it a flag.
Bull Flag vs Bear Flag: what's the difference?
The same structure pointing the other way, and in both the flag slopes against the trend: a bear flag's bounce drifts up, a bull flag's pullback drifts down. Judged alone, either flag looks like a reversal, so read the direction from the pole.
Bull Flag vs Bull Pennant: what's the difference?
Both follow a steep rally, break upward and take their target from the pole; the boundaries are the tell. A bull flag's lines run parallel, usually tilting down, while a bull pennant's converge toward an apex. Same trade, different shape.
Bull Flag vs Descending Channel: what's the difference?
A bull flag is a short, falling channel that follows a steep advance. Look left: if the drift lower comes straight after a sharp rally and lasts fewer bars than that rally, read it as a bull flag, not as a downtrend to sell.
Bull Flag vs Head and Shoulders: what's the difference?
A bull flag stays shallow and tightens before continuing upward; a head and shoulders forms three peaks and resolves downward. If the consolidation is making distinct peaks and deepening rather than contracting, it is a reversal, not a flag.
Bull Flag vs Horizontal Channel: what's the difference?
A bull flag is brief and usually drifts slightly down against a steep pole. A horizontal channel is flat, usually lasts longer, can follow any trend, and is defined by repeated touches of both lines rather than by the impulse before it.
How reliable is the bull flag pattern?
Flags are among the better-documented chart patterns, and there is a coherent reason why: unlike most candlestick shapes, a flag has objective, testable criteria — a measurable impulse, a bounded retracement depth, a bounded duration, and a defined breakout level. That makes it possible to study consistently, and the standard references treat continuation patterns in strong trends as one of the more dependable categories. The caveats still apply. Published success rates depend on the retracement and duration limits chosen, and a great deal of what traders label a bull flag would fail a strict definition — most obviously the requirement that the flagpole be a genuine steep impulse rather than an ordinary rise. The pattern's real strength is that its failure condition is unusually clear: a close back below the flag's low tells you immediately that you were wrong.
References
- Thomas N. Bulkowski. Encyclopedia of Chart Patterns . Wiley , 2005 . ISBN 978-0471668268.
- Robert D. Edwards, John Magee and W.H.C. Bassetti. Technical Analysis of Stock Trends . Routledge , 2018 . ISBN 978-1138069411.
Frequently asked questions
What is the difference between a bull flag and a bear flag?
How deep can a bull flag pull back?
How do you set a target on a bull flag?
Why do bull flags fail?
Practise spotting the bull flag
Reading about a pattern is not the same as recognising it under time pressure. Chart Guess drills 53 patterns as a 60-second game — read the chart, call BUY or SELL, get the pattern name instantly.