Ascending Channel Pattern
An ascending channel is an uptrend contained between two parallel rising trendlines: a lower line through the higher lows and an upper line through the higher highs, with price swinging between them until one side gives way.
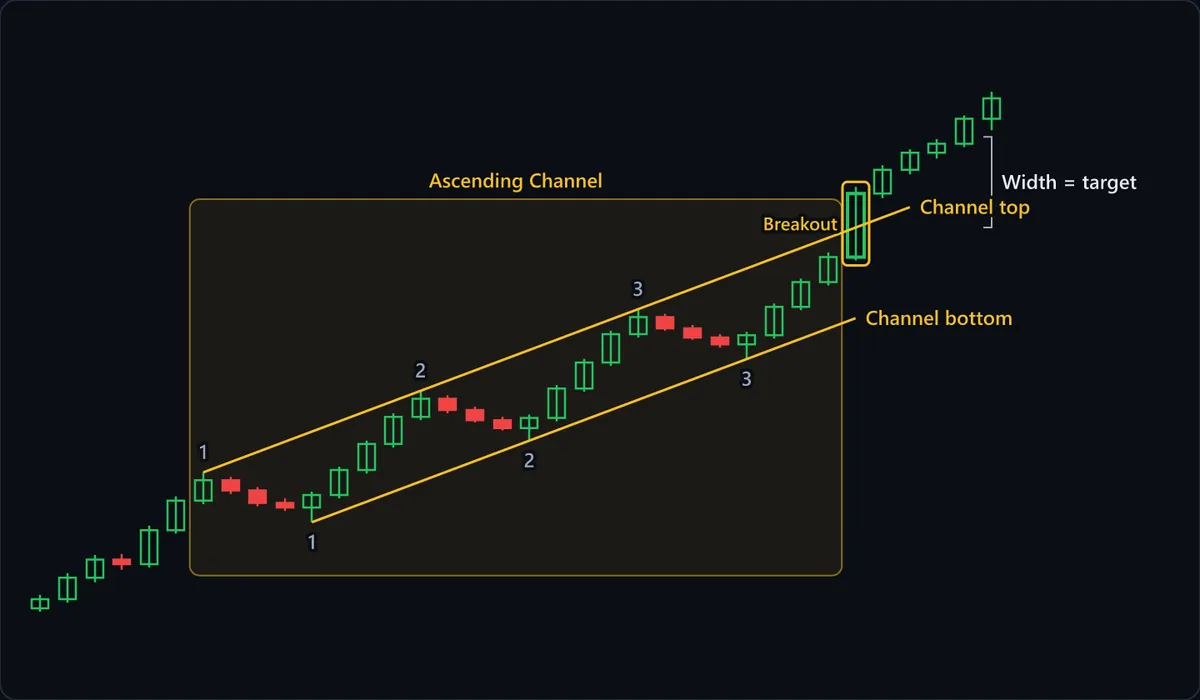
Chart data
| # | Open | High | Low | Close |
|---|---|---|---|---|
| 1 | 80.4 | 81.6 | 80.1 | 81.2 |
| 2 | 81.2 | 83.5 | 80.9 | 83.1 |
| 3 | 83.1 | 85.1 | 82.7 | 84.7 |
| 4 | 84.7 | 85.2 | 83.8 | 84.3 |
| 5 | 84.3 | 87.7 | 84 | 87.3 |
| 6 | 87.3 | 90.3 | 87 | 89.9 |
| 7 | 89.9 | 92.4 | 89.6 | 91.7 |
| 8 | 91.7 | 92 | 90.5 | 90.8 |
| 9 | 90.8 | 91.1 | 89.4 | 89.7 |
| 10 | 89.7 | 90.1 | 89 | 89.3 |
| 11 | 89.3 | 90.7 | 88 | 90.4 |
| 12 | 90.4 | 92.9 | 90.1 | 92.6 |
| 13 | 92.6 | 95.2 | 92.3 | 94.9 |
| 14 | 94.9 | 97.6 | 94.6 | 97.3 |
| 15 | 97.3 | 99.6 | 97 | 98.9 |
| 16 | 98.9 | 99.2 | 97.6 | 97.9 |
| 17 | 97.9 | 98.2 | 96.8 | 97 |
| 18 | 97 | 97.3 | 96.1 | 96.3 |
| 19 | 96.3 | 97.5 | 95.2 | 97.2 |
| 20 | 97.2 | 100.1 | 96.9 | 99.8 |
| 21 | 99.8 | 102.4 | 99.5 | 102.1 |
| 22 | 102.1 | 104.9 | 101.8 | 104.6 |
| 23 | 104.6 | 106.8 | 104.3 | 106.1 |
| 24 | 106.1 | 106.4 | 104.9 | 105.1 |
| 25 | 105.1 | 105.4 | 104.1 | 104.3 |
| 26 | 104.3 | 104.6 | 103.4 | 103.7 |
| 27 | 103.7 | 104.8 | 102.4 | 104.5 |
| 28 | 104.5 | 107.3 | 104.2 | 107 |
| 29 | 107 | 109.5 | 106.7 | 109.2 |
| 30 | 109.2 | 111.8 | 108.9 | 111.4 |
| 31 | 111.4 | 117.6 | 111.1 | 117 |
| 32 | 117 | 119.5 | 116.6 | 119.1 |
| 33 | 119.1 | 120.9 | 118.7 | 120.6 |
| 34 | 120.6 | 121.8 | 120.1 | 121.4 |
| 35 | 121.4 | 123.9 | 121.1 | 123.6 |
| 36 | 123.6 | 126 | 122.6 | 125.4 |
At a glance
| Type | Continuation |
|---|---|
| Direction | With the trend |
| Bars required | Multiple bars |
| Family | Chart pattern |
| Evidence | Moderate |
| Also called | rising channel, upward channel, ascending price channel, rising trend channel |
What timeframe does it work on?
Channels appear on every timeframe, but the rails mean more when each touch is a separate swing built over several bars, as on a four-hour or daily chart. On a one- or five-minute chart a touch is often a single wick, and the lines can be redrawn to fit almost anything. A rail left untested for a long stretch describes an old slope, not the present one.
Anatomy of the pattern
- Channel bottom (lows 1-3) — The rising support line, drawn through two higher lows and confirmed by a third. This is the rail the with-trend trade is built on: it marks where buyers have repeatedly paid more than they did on the previous dip.
- Channel top (highs 1-3) — A line through the swing highs, parallel to the bottom. It shows where buyers have been content to take profit on each leg. Unlike a flat ceiling it climbs with the trend, so selling there means trading against the dominant direction.
- The rhythm between the rails — Each rally travels the full width of the channel and each pullback returns to the lower line. That repetition is the pattern. When a rally stalls in the middle instead of reaching the top, the rhythm has broken before price has.
- Breakout — The tall green candle that closes above the channel top. Leaving through the upper side signals that the trend may be accelerating beyond its old slope, provided price holds above the line. It is a sign of strength, but it retires the channel as a map.
- Width = target — The vertical distance between the two rails projected from the break. On the chart it is projected upward from the breakout; on a close below the channel bottom the same width is projected downward. It sizes the next leg as a convention, not a forecast.
How to identify it
- Price is already making higher highs and higher lows; the channel describes an existing uptrend, not a future one.
- At least two lows touch the lower line and at least two highs touch the upper line; a third touch on either side turns a drawn line into a tested one.
- The two lines are parallel, or close enough that the distance between them stays roughly constant from the first touch to the latest.
- Rallies reach the upper line and pullbacks reach the lower line, rather than reversing somewhere in the middle of the channel.
- Closes stay inside the rails. An occasional wick through a line is tolerated; a close through it is not.
- Check the most recent swing: if the last rally fell short of the upper line, the channel is still intact but its momentum is already fading.
How to trade it
Entry. Buy near the lower channel line once a bullish candle confirms the bounce: a close back up off the rail, not just a touch of it. Waiting for that candle helps avoid buying a pullback that slices straight through support, though a confirmed bounce can still fail. The advanced trade is the reverse: a short once price closes below the lower line, most convincingly after a rally that failed to reach the upper line.
Stop. Below the lower channel line for a long, a little beneath the low of the bounce. The rail is the reason for the trade; a close under it breaks the support the channel was drawn from, so the long no longer has a basis. Because the line rises every bar, many traders step the stop up along it as the trade develops.
Target. The upper channel line, which rises the longer the rally takes. For the breakdown short, project the channel's width below the break. If price instead closes above the top, as on this chart, the same width is commonly projected upward from the breakout.
What invalidates it
- A close below the lower trendline. It breaks the rising support the channel was drawn from and retires the channel; the uptrend itself is only confirmed over if price goes on to make a lower low. The break is most significant when the previous rally failed to reach the upper line.
- A rally that stalls well short of the upper line. The channel is not broken yet, but this is the usual warning before a breakdown, and buying the next bounce after one is the classic mistake.
- The rails stop being parallel. If the lower line climbs faster than the upper one, the range is narrowing into a rising wedge, which leans bearish rather than with the trend.
- One side has only a single touch. Two lows and one high, or the reverse, is a guess about where the channel might be, not a channel.
Often confused with
Ascending Channel vs Ascending Triangle: what's the difference?
An ascending triangle has a flat ceiling over rising lows, so the range narrows toward a breakout. In an ascending channel the ceiling climbs with the floor and the range stays roughly the same width. Flat top: triangle. Top rising parallel to the floor: channel. Rising but converging: rising wedge.
Ascending Channel vs Bearish Wolfe Wave: what's the difference?
In an ascending channel the upper and lower lines run roughly parallel. A bearish Wolfe wave needs the 2-4 line to climb faster than the 1-3 line, so the range narrows before point 5.
Ascending Channel vs Bull Flag: what's the difference?
A bull flag's consolidation drifts sideways or down, against the trend, and lasts only briefly after a steep flagpole. An ascending channel slopes up, with the trend, and can run for many swings. Parallel lines pointing upward with no pole beneath them make a channel, not a flag.
Ascending Channel vs Descending Channel: what's the difference?
The mirror image. An ascending channel rises through higher highs and higher lows, and its with-trend trade is a long off the lower rail; a descending channel's is a short off the upper rail.
Ascending Channel vs Rising Wedge: what's the difference?
Both climb between two rising lines. In an ascending channel the lines are parallel, so highs and lows advance at the same pace; in a rising wedge support rises faster and the range narrows. If the gap between your lines is not shrinking, it is a channel.
How reliable is the ascending channel pattern?
Channels are covered in the standard references as a basic trend tool, and the evidence rates moderate rather than well documented for a structural reason: an ascending channel is a line-drawing exercise. The trader chooses which highs and lows to connect, whether to use wicks or closes, and whether the upper line is fitted independently or copied parallel from the lower one, and each choice moves the entry, the stop and the breakout level. What the pattern does well is describe an uptrend while it lasts and mark clearly when that orderly advance has broken down, with a close below the lower rail. It cannot say how long the trend will continue. No success rate is quoted here, because none is meaningful without the drawing rules behind it.
References
- John J. Murphy. Technical Analysis of the Financial Markets . New York Institute of Finance , 1999 . ISBN 978-0735200661.
- Thomas N. Bulkowski. Encyclopedia of Chart Patterns . Wiley , 2005 . ISBN 978-0471668268.
Frequently asked questions
What does an ascending channel mean?
Is an ascending channel bullish or bearish?
How do you trade an ascending channel?
Should you short the top of an ascending channel?
What happens when price breaks above an ascending channel?
Practise spotting the ascending channel
Reading about a pattern is not the same as recognising it under time pressure. Chart Guess drills 53 patterns as a 60-second game — read the chart, call BUY or SELL, get the pattern name instantly.