Bear Pennant Pattern
A bear pennant is a bearish continuation pattern in which a steep decline, the pole, is followed by a brief, small consolidation between converging trendlines, before price closes below the lower line and the sell-off resumes.
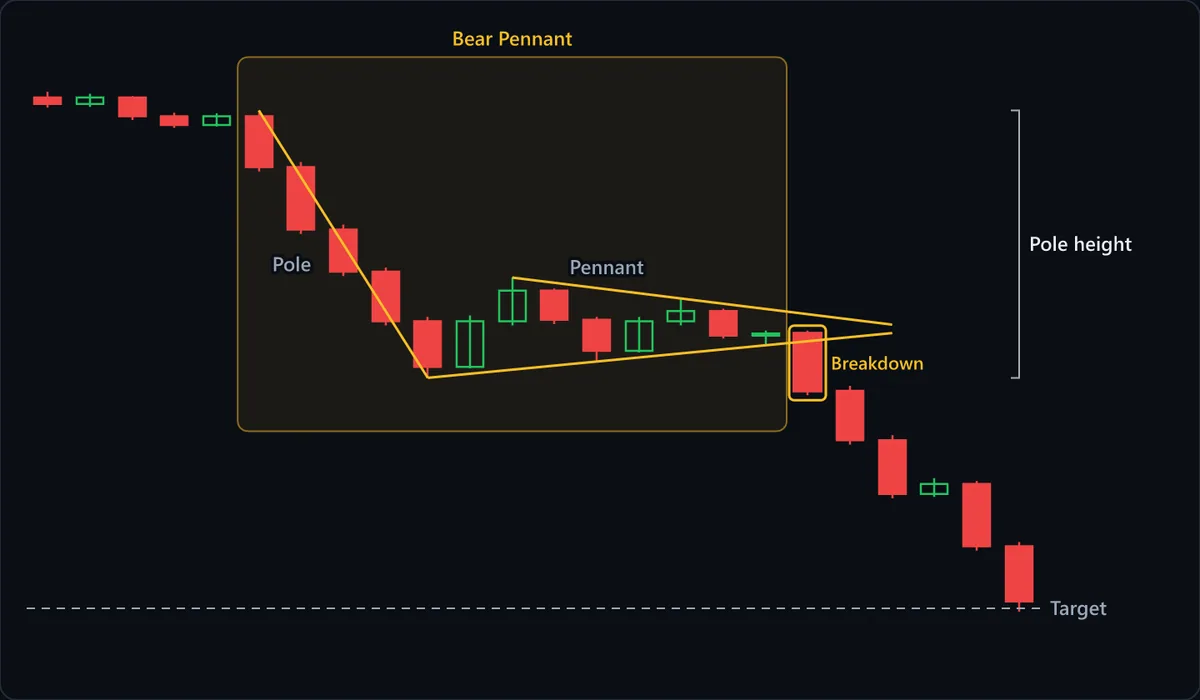
Chart data
| # | Open | High | Low | Close |
|---|---|---|---|---|
| 1 | 123.3 | 123.7 | 122.6 | 122.85 |
| 2 | 122.85 | 123.55 | 122.65 | 123.3 |
| 3 | 123.3 | 123.4 | 121.75 | 122 |
| 4 | 122 | 122.25 | 121.2 | 121.4 |
| 5 | 121.4 | 122.2 | 121.3 | 122 |
| 6 | 122 | 122.4 | 118.2 | 118.5 |
| 7 | 118.5 | 118.85 | 113.9 | 114.2 |
| 8 | 114.2 | 114.55 | 111 | 111.3 |
| 9 | 111.3 | 111.6 | 107.6 | 107.9 |
| 10 | 107.9 | 108.2 | 104 | 104.75 |
| 11 | 104.75 | 108.3 | 104.65 | 107.9 |
| 12 | 107.9 | 110.9 | 107.6 | 110 |
| 13 | 110 | 110.15 | 107.7 | 108 |
| 14 | 108 | 108.2 | 105.12 | 105.85 |
| 15 | 105.85 | 108.2 | 105.75 | 107.9 |
| 16 | 107.9 | 109.46 | 107.6 | 108.6 |
| 17 | 108.6 | 108.75 | 106.7 | 106.9 |
| 18 | 106.9 | 107.25 | 106.24 | 107.05 |
| 19 | 107.05 | 107.25 | 102.8 | 103.1 |
| 20 | 103.1 | 103.45 | 99.4 | 99.7 |
| 21 | 99.7 | 100.05 | 95.7 | 96 |
| 22 | 96 | 97.1 | 95.8 | 96.7 |
| 23 | 96.7 | 96.9 | 92.1 | 92.4 |
| 24 | 92.4 | 92.7 | 87.9 | 88.6 |
At a glance
| Type | Continuation |
|---|---|
| Direction | With the trend |
| Bars required | Multiple bars |
| Family | Chart pattern |
| Evidence | Well documented |
| Also called | bearish pennant, bear pennant pattern, bearish pennant chart pattern |
What timeframe does it work on?
Bear pennants appear on intraday and daily charts alike, because the ingredients are a sharp drop and a pause, not a time of day. What must scale is the pennant's length: on a daily chart the classic texts treat it as a matter of days to a few weeks, and on a 5-minute chart the same structure spans a handful of bars. A coil that keeps tightening long after the pole is old news is better read as a symmetrical triangle.
Anatomy of the pattern
- Pole — A fast, nearly straight drop made of large red candles with small bounces or none. In the chart, five candles carry price from about 122 to 104. The speed matters: it leaves sellers who missed the move looking for any bounce to sell into.
- Pennant — A small triangle where lower highs meet higher lows. The bounces are mostly short covering and they keep shrinking, which says buyers cannot build on them. In the chart the biggest bounce recovers little more than a third of the pole before the range starts to narrow.
- Converging trendlines — The upper line slopes down and the lower line slopes up, so the range compresses toward an apex. That is what separates a pennant from a bear flag, whose boundaries run parallel.
- Breakdown — The candle that closes below the lower line. In the chart it is a full-bodied red candle that opens inside the pennant and closes near its low, well beneath the line, rather than a wick that pokes through and recovers.
- Pole height and target — The pole's height, measured from where the drop began to the pennant's first low, is subtracted from the breakdown point. Here that is about 18 points taken from roughly 106.5, which places the dashed Target line near 88.
How to identify it
- A steep, recent decline sits directly before the consolidation; you can point to where the pole starts and ends.
- The consolidation is small next to the pole, with bounces that recover only a modest part of the drop.
- Each bounce peaks lower and each dip holds higher, so a falling upper line and a rising lower line can both be drawn.
- Candle ranges shrink and, where volume is available, it fades through the pennant.
- The pattern is brief: the breakdown arrives while the lines are still visibly apart, not after they have crossed.
- The trigger is a candle close below the lower line, not an intraday dip through it.
How to trade it
Entry. The textbook entry is a close below the pennant's lower line. Shorting inside the pennant on the hope that it breaks is the mistake the pattern punishes most, because a coil can resolve upward and a short squeeze off a sold-out low is fast. Waiting for the close gives up a little price in exchange for proof that buyers' higher lows have finally failed.
Stop. Above the pennant's highest point, which in the chart is the top of the first bounce, near 110.9, where the upper line begins. That high is the best buyers managed during the pause; a close above it means the coil has turned into a recovery and the continuation idea is wrong. A stop just above the lower line is tighter but sits inside the pennant's normal noise.
Target. Subtract the pole height from the breakdown point. It is a measuring convention, not a forecast, so check what sits between entry and target: a prior swing low or round number partway down is a common place for the decline to stall and for shorts to cover.
What invalidates it
- A close above the pennant's high. Buyers have reclaimed the whole pause, and the setup is no longer a continuation.
- Price drifts past the apex without breaking. Once the lines have met, the compression that defined the pattern is spent and the pattern has expired.
- There was no real pole. A slow, choppy decline followed by a small triangle is just a triangle, with no impulse for the pennant to continue.
- The bounces grow instead of shrinking. Widening swings mean buyers are gaining ground, which is the opposite of the pennant's logic.
- The breakdown closes below the line and the next candles close back inside the pennant. A failed breakdown often traps late shorts and can fuel a sharp move up.
Often confused with
Bear Pennant vs Bear Flag: what's the difference?
Both follow a steep pole down. A bear flag's pause drifts up between parallel lines; a pennant's narrows to a point. If the range narrows because highs fall while lows rise, it is a pennant; if both lines rise while narrowing, it is closer to a rising wedge.
Bear Pennant vs Rising Wedge: what's the difference?
In a rising wedge both trendlines slope upward as price grinds higher. In a bear pennant the upper line slopes down and the lower line slopes up, so highs are falling while lows rise.
Bear Pennant vs Symmetrical Triangle: what's the difference?
A symmetrical triangle can form anywhere, takes far longer, can break either way (more often with the prior trend), and has no pole defining its bias. A bear pennant is a small triangle hanging directly off a sharp drop, and that pole is what gives it a bearish lean.
How reliable is the bear pennant pattern?
Pennants sit alongside flags as one of the better-documented continuation patterns, for the same reason: the definition is testable. A measurable pole, converging boundaries, a short duration limit and a defined break level can be checked consistently, and Edwards and Magee discuss flags and pennants together as continuation formations that are most dependable when the preceding move is genuinely sharp, though not every reference rates the pennant as highly. The caveats are specific to the pennant. Its boundaries are drawn on only a few small swings, so two traders can sketch different lines and get different breakdown points. Published results also depend on how long a pennant is allowed to last before it is called a triangle, and on whether a close or a touch counts as the break. A pattern labeled a bear pennant can fail a strict reading, most often because the pole was not steep enough. The short duration limit is the pennant's built-in check: if it is still coiling near the apex, the pole's momentum is gone and the read no longer applies.
References
- Thomas N. Bulkowski. Encyclopedia of Chart Patterns . Wiley , 2005 . ISBN 978-0471668268.
- Robert D. Edwards, John Magee and W.H.C. Bassetti. Technical Analysis of Stock Trends . Routledge , 2018 . ISBN 978-1138069411.
Frequently asked questions
What does a bear pennant mean?
Is a bear pennant bullish or bearish?
What happens after a bear pennant breaks down?
Does a bear pennant need confirmation?
How long does a bear pennant last?
Practise spotting the bear pennant
Reading about a pattern is not the same as recognising it under time pressure. Chart Guess drills 53 patterns as a 60-second game — read the chart, call BUY or SELL, get the pattern name instantly.