Symmetrical Triangle Pattern
A symmetrical triangle is a chart pattern in which a series of lower highs and higher lows converge at roughly equal angles toward a point, compressing price until it closes outside one of the two trendlines. It is traditionally read as continuing the trend that came before it.
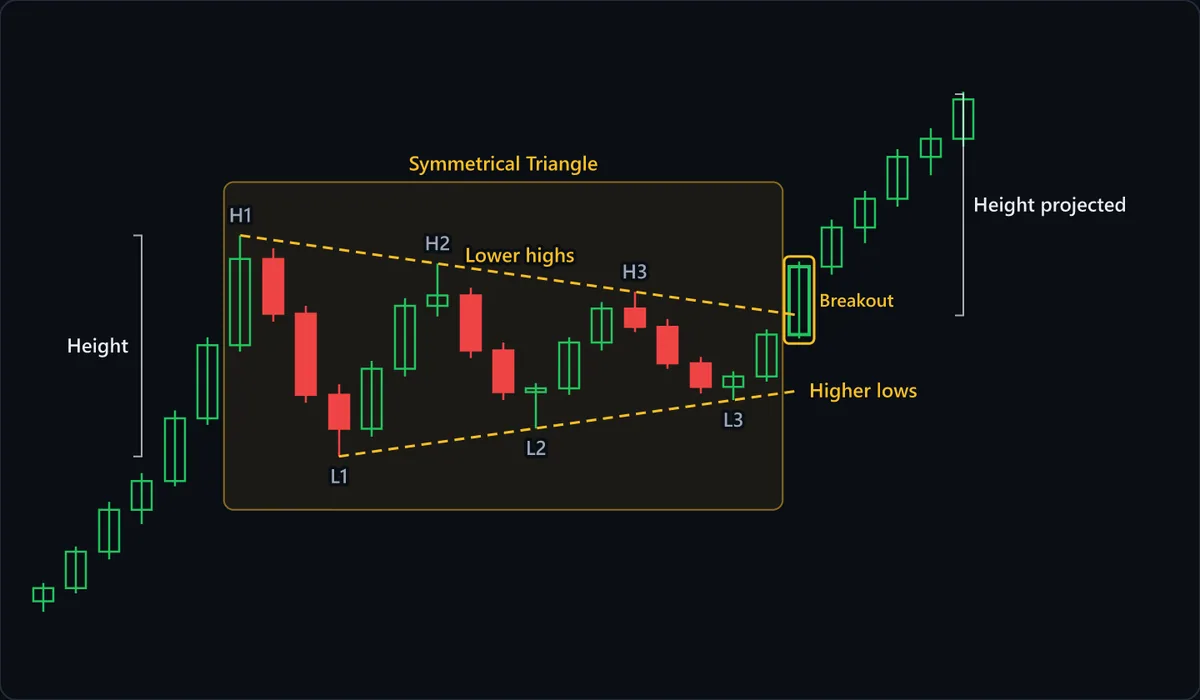
Chart data
| # | Open | High | Low | Close |
|---|---|---|---|---|
| 1 | 90 | 91.4 | 89.2 | 91 |
| 2 | 91 | 94.2 | 90.6 | 93.8 |
| 3 | 93.8 | 97.6 | 93.2 | 97 |
| 4 | 97 | 99.8 | 95.9 | 99.2 |
| 5 | 99.2 | 104.6 | 98.8 | 104 |
| 6 | 104 | 110.2 | 103.5 | 109.6 |
| 7 | 109.6 | 118 | 109.1 | 116.2 |
| 8 | 116.2 | 117 | 111.4 | 112 |
| 9 | 112 | 112.6 | 105.2 | 105.8 |
| 10 | 105.8 | 106.6 | 101.08 | 103.2 |
| 11 | 103.2 | 108.4 | 102.6 | 107.8 |
| 12 | 107.8 | 113.2 | 107.2 | 112.6 |
| 13 | 112.6 | 115.84 | 111.8 | 113.4 |
| 14 | 113.4 | 114 | 108.6 | 109.2 |
| 15 | 109.2 | 109.8 | 105.4 | 106 |
| 16 | 106 | 106.7 | 103.24 | 106.3 |
| 17 | 106.3 | 110.2 | 105.8 | 109.8 |
| 18 | 109.8 | 112.9 | 109.2 | 112.4 |
| 19 | 112.4 | 113.68 | 110.6 | 111 |
| 20 | 111 | 111.6 | 107.8 | 108.2 |
| 21 | 108.2 | 108.7 | 105.9 | 106.4 |
| 22 | 106.4 | 107.6 | 105.4 | 107.2 |
| 23 | 107.2 | 110.8 | 106.8 | 110.4 |
| 24 | 110.4 | 116 | 110.1 | 115.6 |
| 25 | 115.6 | 119.2 | 115 | 118.6 |
| 26 | 118.6 | 121.4 | 117.4 | 120.8 |
| 27 | 120.8 | 124.6 | 120.2 | 124 |
| 28 | 124 | 126.2 | 122.6 | 125.4 |
| 29 | 125.4 | 129 | 124.8 | 128.4 |
At a glance
| Type | Continuation |
|---|---|
| Direction | With the trend |
| Bars required | Multiple bars |
| Family | Chart pattern |
| Evidence | Moderate |
| Also called | symmetrical triangle pattern, symmetric triangle, coil pattern, symmetrical triangle breakout |
What timeframe does it work on?
It appears on every timeframe, but it needs at least four clean swing points to draw both lines, so on very short intraday charts random wiggles can fake one easily. On daily charts a symmetrical triangle typically takes weeks to months to build. A very small, brief triangle that follows a sharp, near-vertical move is usually classed as a pennant instead, which carries a stronger directional bias.
Anatomy of the pattern
- Prior trend — The move into the triangle sets the default expectation. Here it is an advance, so the continuation case is an upside break. The same shape after a decline would lean down, which is why the pattern is filed as continuation rather than bullish or bearish.
- Falling highs (H1–H3) — Each rally stalls below the last one. Sellers are willing to sell slightly cheaper each time, and the line through these peaks slopes down at about the same angle the lower line slopes up.
- Rising lows (L1–L3) — Each dip is bought slightly higher than the one before. Buyers are paying up, but not enough to beat the falling highs, so neither side has the upper hand while price stays inside.
- The Breakout candle — A full-bodied close above the lower-highs line. In this chart it arrives roughly two-thirds of the way from H1 to the point where the lines would meet, inside the window where breaks tend to carry rather than fizzle.
- Height and Height projected — The widest distance between the lines, measured at the start from L1 up to H1, is added to the price where the upper line was broken. The two brackets on the chart are the same length.
How to identify it
- At least two lower highs and two higher lows, so each line rests on two or more real touches.
- The upper line falls and the lower line rises at similar angles. If one is nearly flat, you are looking at an ascending or descending triangle instead.
- Swings get progressively smaller from left to right, and volume usually tapers off as the range contracts.
- A measurable trend leads into the formation, which gives you the default direction to favor if the break confirms it.
- The breakout is a close beyond one line, ideally between half and three-quarters of the distance from the first swing to the apex.
- The breakout candle has a larger range than the recent ones inside the triangle, ideally on rising volume (especially for upside breaks), showing that the compression has actually released.
How to trade it
Entry. Wait for a candle to close outside the triangle, and accept the break in either direction. The direction of the prior trend is the one to prefer, which is why the example here is traded long, but a decisive close below the rising line is a short signal, not a reason to hold out for the upside. Guessing the side before the close is the classic error with this pattern.
Stop. Just inside the triangle, beyond the most recent swing on the opposite side: below L3 for an upside break, above the last lower high for a downside one. That swing is the last point where the breakout side held its ground inside the pattern, so a return past it means the break did not take.
Target. Measure the triangle at its widest point, the first high to the first low, and project that height from the breakout level in the direction of the break. It is a convention, not a promise, and breaks close to the apex have the least room to deliver it.
What invalidates it
- Price closes back inside the triangle soon after the break and runs toward the opposite line. That fakeout is common with this pattern and often fuels a move the other way.
- Price drifts out near the apex with small candles and no expansion. When the range has squeezed to nothing, a break carries little information and leaves little room for the projection to play out.
- One of the lines rests on a single touch, or the swings do not actually narrow. Without convergence there is no coil, only a range you have drawn lines on.
Often confused with
Symmetrical Triangle vs Ascending Triangle: what's the difference?
An ascending triangle has a flat top, with rallies stalling at the same price while lows rise. In a symmetrical triangle the highs fall too. Check whether H2 and H3 sit below H1 or level with it.
Symmetrical Triangle vs Bear Pennant: what's the difference?
A symmetrical triangle can form anywhere, takes far longer, can break either way (more often with the prior trend), and has no pole defining its bias. A bear pennant is a small triangle hanging directly off a sharp drop, and that pole is what gives it a bearish lean.
Symmetrical Triangle vs Broadening Bottom: what's the difference?
The lines run in opposite directions. A symmetrical triangle has falling highs and rising lows that converge toward an apex; a broadening bottom has rising highs and falling lows that spread apart.
Symmetrical Triangle vs Broadening Top: what's the difference?
A triangle's lines converge, so each swing is smaller than the last and volume usually fades. A broadening top's lines diverge, swings grow and volume tends to rise. Measure two consecutive swings: shrinking means triangle, growing means megaphone.
Symmetrical Triangle vs Bull Pennant: what's the difference?
A pennant is a small, brief consolidation off a steep flagpole. If the prior move was an ordinary trend, not a near-vertical burst, and the formation takes many swings, it is a symmetrical triangle, whose lean toward the prior trend is weaker than a pennant's and needs the break to confirm it.
Symmetrical Triangle vs Descending Triangle: what's the difference?
A symmetrical triangle pairs lower highs with higher lows, so both lines converge and the shape implies no direction. A descending triangle's lower line is flat: buyers refuse to bid any higher, and that refusal is where its bearish tilt comes from.
Symmetrical Triangle vs Diamond Bottom: what's the difference?
A diamond's right half looks like a symmetrical triangle, but a triangle starts wide and only narrows. Look left of the widest point: if the swings there were expanding out of a selloff, it is a diamond; if the range was wide from its first swing, it is a triangle.
Symmetrical Triangle vs Diamond Top: what's the difference?
A symmetrical triangle contracts from its first swing, while a diamond's contraction follows a widening phase. If the swings that precede the converging lines are themselves expanding at the top of a rally, the triangle is the right half of a diamond.
Symmetrical Triangle vs Rising Wedge: what's the difference?
Both lines of a rising wedge slope upward, with highs and lows each climbing. In a symmetrical triangle the lines point toward each other from opposite directions, one falling and one rising.
How reliable is the symmetrical triangle pattern?
The symmetrical triangle is one of the most studied chart formations, covered in every major chart-pattern reference and among the triangle forms tested algorithmically by Lo, Mamaysky and Wang. It sits at moderate rather than well-documented because the classic texts agree on its shape but not on its direction: they file it as continuation while noting it can also mark a reversal. Published outcomes also move with the rules chosen, such as how many touches qualify, whether a close or a wick counts as the break, and how near the apex a break may come. Its practical strength is that it waits for you: trading only the confirmed close removes the direction guess, and the opposite swing marks clearly where you were wrong.
References
- Thomas N. Bulkowski. Encyclopedia of Chart Patterns . Wiley , 2005 . ISBN 978-0471668268.
- Robert D. Edwards, John Magee and W.H.C. Bassetti. Technical Analysis of Stock Trends . Routledge , 2018 . ISBN 978-1138069411.
- Andrew W. Lo, Harry Mamaysky and Jiang Wang. Foundations of Technical Analysis: Computational Algorithms, Statistical Inference, and Empirical Implementation . The Journal of Finance , 2000 .
Frequently asked questions
What does a symmetrical triangle mean?
Is a symmetrical triangle bullish or bearish?
How do you trade a symmetrical triangle?
What happens if a symmetrical triangle breaks out at the apex?
How reliable is the symmetrical triangle?
Practise spotting the symmetrical triangle
Reading about a pattern is not the same as recognising it under time pressure. Chart Guess drills 53 patterns as a 60-second game — read the chart, call BUY or SELL, get the pattern name instantly.