Broadening Top Pattern (Megaphone Top)
A broadening top is a bearish reversal chart pattern that forms after an uptrend, in which price swings between a rising upper trendline and a falling lower trendline, making higher highs and lower lows until a close below the lower line ends the advance.
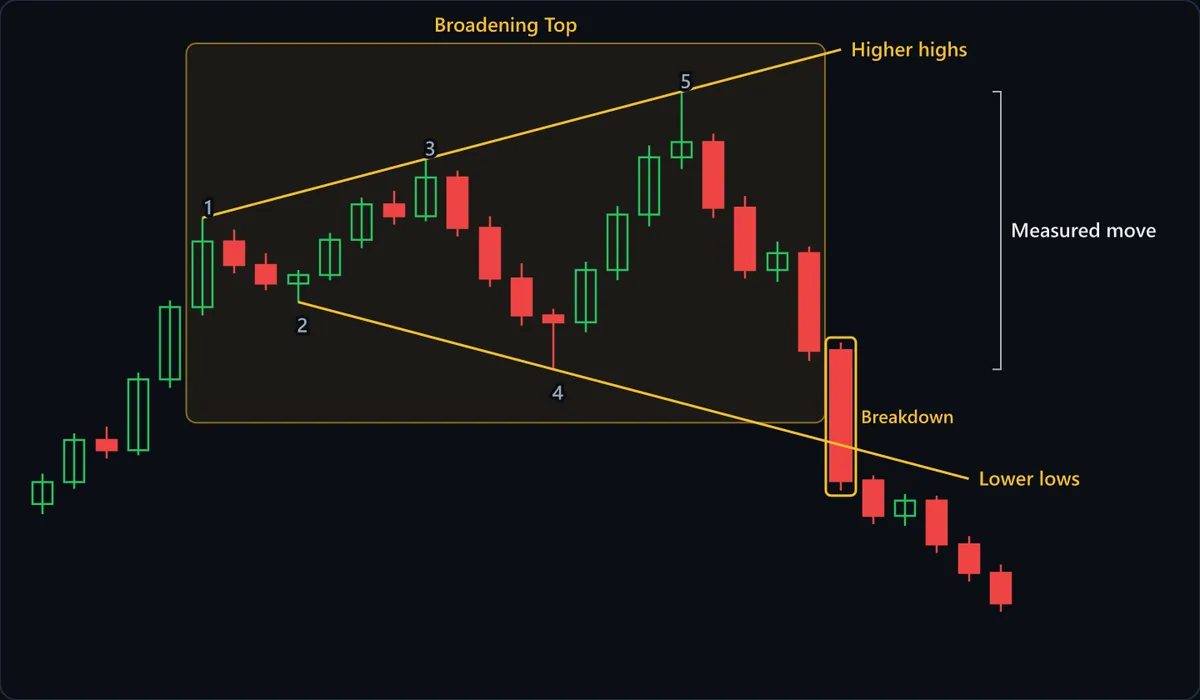
Chart data
| # | Open | High | Low | Close |
|---|---|---|---|---|
| 1 | 99 | 100.8 | 98.4 | 100.3 |
| 2 | 100.3 | 103.2 | 99.9 | 102.8 |
| 3 | 102.8 | 103.6 | 101.7 | 102.2 |
| 4 | 102.2 | 106.8 | 101.9 | 106.4 |
| 5 | 106.4 | 111.1 | 105.9 | 110.7 |
| 6 | 110.7 | 116 | 110.2 | 114.6 |
| 7 | 114.6 | 115.3 | 112.7 | 113.2 |
| 8 | 113.2 | 113.9 | 111.7 | 112.1 |
| 9 | 112.1 | 112.9 | 111 | 112.6 |
| 10 | 112.6 | 115.1 | 112.3 | 114.7 |
| 11 | 114.7 | 117.2 | 114.2 | 116.8 |
| 12 | 116.8 | 117.6 | 115.6 | 116.1 |
| 13 | 116.1 | 119.5 | 115.8 | 118.4 |
| 14 | 118.4 | 118.8 | 114.9 | 115.4 |
| 15 | 115.4 | 116.1 | 111.9 | 112.4 |
| 16 | 112.4 | 113.3 | 109.6 | 110.2 |
| 17 | 110.2 | 110.6 | 107 | 109.8 |
| 18 | 109.8 | 113.4 | 109.2 | 112.9 |
| 19 | 112.9 | 116.7 | 112.3 | 116.2 |
| 20 | 116.2 | 120.3 | 115.5 | 119.6 |
| 21 | 119.6 | 123.5 | 118.9 | 120.5 |
| 22 | 120.5 | 121 | 116 | 116.6 |
| 23 | 116.6 | 117.3 | 112.4 | 112.9 |
| 24 | 112.9 | 114.6 | 112.2 | 113.9 |
| 25 | 113.9 | 114.3 | 107.5 | 108.1 |
| 26 | 108.1 | 108.6 | 99.8 | 100.4 |
| 27 | 100.4 | 100.7 | 97.8 | 98.3 |
| 28 | 98.3 | 99.6 | 97.7 | 99.2 |
| 29 | 99.2 | 99.5 | 96.1 | 96.6 |
| 30 | 96.6 | 97.1 | 94.4 | 94.9 |
| 31 | 94.9 | 95.4 | 92.6 | 93.1 |
At a glance
| Type | Bearish reversal |
|---|---|
| Direction | Bearish |
| Bars required | Multiple bars |
| Family | Chart pattern |
| Evidence | Moderate |
| Also called | megaphone top, broadening top pattern, bearish megaphone, broadening top formation |
What timeframe does it work on?
Broadening tops are mainly a daily and weekly pattern, where the five turning points take weeks or months and reflect a market grown nervous after a long advance. Intraday charts produce plenty of expanding swings around news and session opens, but those widen for mechanical reasons and carry less meaning. If all five turning points fit inside a handful of bars, it is noise, not a megaphone.
Anatomy of the pattern
- Prior uptrend — The pattern is a top, so it needs an advance to end. On the chart, a run of rising candles carries price into point 1; without it, an expanding range is just volatility.
- Higher highs (points 1, 3, 5) — Each rally reaches above the last, so the line through the peaks rises. Every new high looks like a breakout and pulls in late buyers, which is why each reversal does so much damage.
- Lower lows (points 2, 4) — Each sell-off undercuts the previous trough, so the line through the lows falls. Sellers grow more aggressive at the same time as buyers, and the lines diverge into a megaphone.
- The failed rally — After peak 5, a rebound stalls far below the upper line. It is the first swing to break the expanding rhythm, and the earliest concrete sign that buyers can no longer force a new extreme.
- Breakdown — A close below the falling lower trendline. Because that line slopes down, a late break triggers at a lower price; conservative traders following Edwards and Magee also wait for a close below trough 4.
- Measured move — The widest vertical distance in the pattern, here peak 5 to trough 4, projected down from the breakdown. A megaphone is wide by construction, so nearer support often matters first.
How to identify it
- A clear uptrend precedes the formation, and the first peak sits near the high of that advance.
- There are at least five alternating turning points: three peaks, each higher than the last, and two troughs, each lower than the last.
- A line through the peaks rises and a line through the troughs falls, so the lines diverge rather than run parallel or converge.
- Each swing covers more price than the one before it. If the swings are shrinking, the range is contracting and the pattern is something else.
- Volume tends to grow with the swings, though it is often irregular from one swing to the next.
- Completion usually comes as a rally that falls short of the upper line, followed by a close below the lower line. (Edwards and Magee take the stricter view that the top is confirmed only when price falls below trough 4.)
How to trade it
Entry. Aggressive traders sell a rejection at the upper trendline, such as a reversal candle near a new peak, betting the swing back toward the lower line repeats. Conservative traders wait for a swing that fails to reach the upper line and then a close below the lower trendline, giving up part of the move for evidence that the top has completed rather than simply widened again.
Stop. For a short at the upper line, the stop goes above that line: a sustained close beyond it means the expansion resolved upward. For a breakdown short, it goes above the last lower high, the failed rally that showed buyers were spent. Both stops are wide in a pattern defined by widening swings; squeezing them gets you stopped by ordinary noise, so cut position size instead.
Target. A short from the upper line aims for the lower trendline, the far side of the range the pattern has respected. A breakdown short projects the pattern's widest height down from the break. That height is large by design, so treat it as an outer reference and watch nearer support, such as the base of the prior advance.
What invalidates it
- A sustained close above the upper trendline on expanding volume. Rallies were supposed to fail at that line; when price holds above it, buyers have won.
- The swings stop widening. A lower peak followed by a higher trough means the range is contracting into a diamond or triangle.
- There was no meaningful advance beforehand. An expanding range in a flat or falling market lacks the exhausted buyers that give the top its bearish lean.
- Price breaks the lower line but closes back inside within a bar or two. In a pattern built from failed breakouts, that is one more whipsaw, and it often launches another swing toward the upper line.
- The lines only fit because a stray wick was used as an anchor. If moving one anchor to a nearby close flattens a line, the megaphone may not be there.
Often confused with
Broadening Top vs Broadening Bottom: what's the difference?
Both expand between diverging lines; the difference is what came before. A broadening top forms after an advance and resolves through its falling lower line. A broadening bottom forms after a decline and looks for a break above its rising upper line.
Broadening Top vs Diamond Top: what's the difference?
A broadening top keeps widening, with higher highs and lower lows all the way through. A diamond starts the same way but then contracts; until you see lower highs and higher lows on the right, you are looking at a broadening top, not a diamond.
Broadening Top vs Head and Shoulders: what's the difference?
In a head and shoulders the highest peak is in the middle, flanked by two lower shoulders of similar height. In a broadening top each peak is higher than the last, so the latest is the highest, and the lower line falls through ever-lower troughs, so the breakdown level keeps falling with time.
Broadening Top vs Symmetrical Triangle: what's the difference?
A triangle's lines converge, so each swing is smaller than the last and volume usually fades. A broadening top's lines diverge, swings grow and volume tends to rise. Measure two consecutive swings: shrinking means triangle, growing means megaphone.
How reliable is the broadening top pattern?
The broadening top is a recognized formation in the classic chart-pattern literature and one of the few patterns academic work has defined algorithmically: five alternating extremes, each peak higher and each trough lower. Those objective criteria keep it above weak. It stops short of well documented because the references disagree on how directional it is: Edwards and Magee present it as a bearish formation typical of late, speculative advances, while statistical treatments of broadening formations record breakouts in both directions, so the word top describes where it forms more than how it resolves. Trading it is harder still, because the swings that define it are the swings that stop out tight risk. Its most useful feature is the failed rally, an observable change rather than an interpretation.
References
- Thomas N. Bulkowski. Encyclopedia of Chart Patterns . Wiley , 2005 . ISBN 978-0471668268.
- Robert D. Edwards, John Magee and W.H.C. Bassetti. Technical Analysis of Stock Trends . Routledge , 2018 . ISBN 978-1138069411.
- Andrew W. Lo, Harry Mamaysky and Jiang Wang. Foundations of Technical Analysis: Computational Algorithms, Statistical Inference, and Empirical Implementation . The Journal of Finance , 2000 .
Frequently asked questions
What does a broadening top mean?
Is a broadening top bullish or bearish?
How do you trade a broadening top?
Does a broadening top need confirmation?
How many touches does a broadening top need?
Practise spotting the broadening top
Reading about a pattern is not the same as recognising it under time pressure. Chart Guess drills 53 patterns as a 60-second game — read the chart, call BUY or SELL, get the pattern name instantly.