Island Reversal Chart Pattern
An island reversal is a cluster of one or more candles cut off by a gap on each side: price gaps in the trend's direction, trades in a small isolated range, then gaps back the other way, leaving the island stranded and the trend reversed.
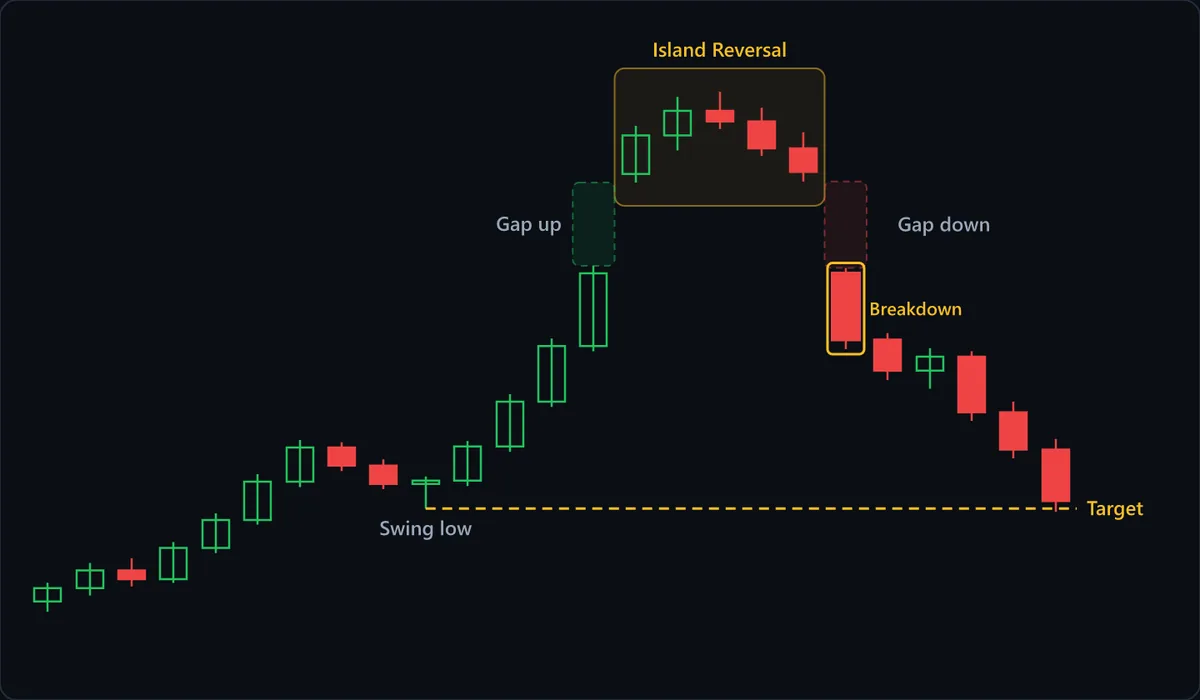
Chart data
| # | Open | High | Low | Close |
|---|---|---|---|---|
| 1 | 90.6 | 91.48 | 90.12 | 91.22 |
| 2 | 91.22 | 92.4 | 90.88 | 92.05 |
| 3 | 92.05 | 92.62 | 91.3 | 91.64 |
| 4 | 91.64 | 93.38 | 91.47 | 93.1 |
| 5 | 93.1 | 94.72 | 92.86 | 94.41 |
| 6 | 94.41 | 96.55 | 94.2 | 96.2 |
| 7 | 96.2 | 98.15 | 95.95 | 97.8 |
| 8 | 97.8 | 98.05 | 96.7 | 96.95 |
| 9 | 96.95 | 97.25 | 95.85 | 96.1 |
| 10 | 96.1 | 96.45 | 94.95 | 96.25 |
| 11 | 96.25 | 98.1 | 96 | 97.85 |
| 12 | 97.85 | 100.3 | 97.6 | 99.95 |
| 13 | 99.95 | 102.9 | 99.7 | 102.55 |
| 14 | 102.55 | 106.3 | 102.3 | 105.95 |
| 15 | 110.6 | 112.85 | 110.2 | 112.4 |
| 16 | 112.4 | 114.2 | 111.7 | 113.55 |
| 17 | 113.55 | 114.45 | 112.7 | 113.05 |
| 18 | 113.05 | 113.7 | 111.45 | 111.8 |
| 19 | 111.8 | 112.55 | 110.25 | 110.7 |
| 20 | 105.95 | 106.2 | 102.4 | 102.85 |
| 21 | 102.85 | 103.15 | 100.95 | 101.4 |
| 22 | 101.4 | 102.45 | 100.55 | 102.05 |
| 23 | 102.05 | 102.3 | 99.05 | 99.45 |
| 24 | 99.45 | 99.95 | 97.3 | 97.7 |
| 25 | 97.7 | 98.2 | 94.8 | 95.3 |
At a glance
| Type | Bearish reversal |
|---|---|
| Direction | Bearish |
| Bars required | Multiple bars |
| Family | Chart pattern |
| Evidence | Moderate |
| Also called | island reversal pattern, island top, island bottom, island gap reversal |
What timeframe does it work on?
Island reversals need real gaps, so they belong on daily stock and index charts, where trading stops between sessions. Intraday charts of the same instruments gap only at the open. Forex and crypto trade around the clock, so true gaps are rare there, and most apparent islands are weekend opens or data artifacts.
Anatomy of the pattern
- Swing low — An island top needs an advance to reverse. Here the rally starts from a labelled swing low, which marks the origin of the move the island ends and later becomes the target.
- Gap up — The first gap runs with the trend and leaves a zone where nothing traded. On a top it is often an exhaustion gap: late buyers chasing a stretched move at prices the advance had not yet reached.
- Island — The stranded candles, one or many, usually in a tight range. They hold the only trades done at these prices in this move, so everyone who bought here holds a position the market has left behind.
- Gap down — The second gap runs against the trend and leaves its own empty zone, ideally near the level of the first gap, so the island is cut off on both sides.
- Breakdown — The first candle after the second gap is the trigger. The gap candle itself never touches the island; the trade is confirmed as long as later candles do not fill the gap.
- Target — The dashed line projects back to the swing low where the run into the island began. Erasing that move is the classic objective; the last swing is the minimum.
How to identify it
- A clear trend leads in: up for an island top, down for an island bottom.
- The first gap is real: on a top, the next candle's low sits above the previous candle's high.
- The second gap runs the other way, and its candle's range does not overlap the island at all.
- The two gaps sit at roughly the same price, leaving empty space on both sides of the island.
- The island holds one or more candles, usually in a range narrow next to the trend before it.
- Price after the second gap does not trade back to fill it and re-enter the island.
How to trade it
Entry. Trade in the direction of the second gap at the close of its first candle, which proves the gap held for a session. The alternative is a partial fill of that gap that stalls short of the island's edge, for a better price. Chasing several candles past the gap stretches the stop until the trade no longer makes sense.
Stop. Beyond the island's far edge: above the island's high on a top, below its low on a bottom. Stranded traders can only escape at island prices, so a move through the whole island means the trap failed. Many traders exit sooner, on a close back inside the island, since that fully fills the second gap.
Target. The origin of the move before the first gap: the swing low that launched the rally into an island top, or the swing high before the decline into an island bottom. The last swing is the minimum. Erasing the whole run is ambitious, so check for levels in between.
What invalidates it
- Price fills the second gap completely and re-enters the island. The stranded traders can now exit near their prices, and the premise is gone.
- Candles on either side overlap the island's range. Without empty space on both sides there is only a gap and a consolidation.
- No trend preceded the first gap. An isolated cluster inside a sideways range has no move to reverse.
- The 'gap' comes from a weekend open, a holiday or a data error in a market that otherwise trades continuously.
Often confused with
Island Reversal vs Evening Star: what's the difference?
An evening star gaps only by the star's real body, so wicks can overlap, and its third candle closes deep into the first body. An island needs full range gaps on both sides and can hold any number of candles. A star gapped by its whole range on both sides is an abandoned baby, a one-candle island.
Island Reversal vs Gap Down: what's the difference?
A gap down is one gap. An island top also needs a gap up into the island at roughly the same level. If the cluster before the gap down overlaps the candles that led into it, so there is no empty space on its left, it is a gap down, not an island.
Island Reversal vs Gap Up: what's the difference?
An island reversal is two gaps in opposite directions with candles stranded between them; a gap up is one gap. An island top begins with a gap up and an island bottom ends with one, so look for an opposing gap on either side.
How reliable is the island reversal pattern?
Island reversals appear in the classic chart-pattern references, and their trapped-trader logic is clear and testable, which earns a moderate rating rather than weak. They fall short of well documented for structural reasons. They are rare, so samples are small. Results depend on the exact gap rules: whether a one-tick overlap counts, and how far apart the two gaps may sit. And in round-the-clock markets the defining gaps barely exist. Direction is not the ambiguity: an island top is bearish and an island bottom bullish. The real test is whether the second gap holds.
References
- Thomas N. Bulkowski. Encyclopedia of Chart Patterns . Wiley , 2005 . ISBN 978-0471668268.
- Robert D. Edwards, John Magee and W.H.C. Bassetti. Technical Analysis of Stock Trends . Routledge , 2018 . ISBN 978-1138069411.
Frequently asked questions
What does an island reversal mean?
Is an island reversal bullish or bearish?
How do you trade an island reversal?
Why are island reversals rare in crypto and forex?
How reliable is the island reversal?
Practise spotting the island reversal
Reading about a pattern is not the same as recognising it under time pressure. Chart Guess drills 53 patterns as a 60-second game — read the chart, call BUY or SELL, get the pattern name instantly.