Triple Top Pattern
A triple top is a bearish reversal pattern in which price rallies to roughly the same high three times after an uptrend, fails each time, and completes only when it closes below the support formed by the two troughs between those peaks.
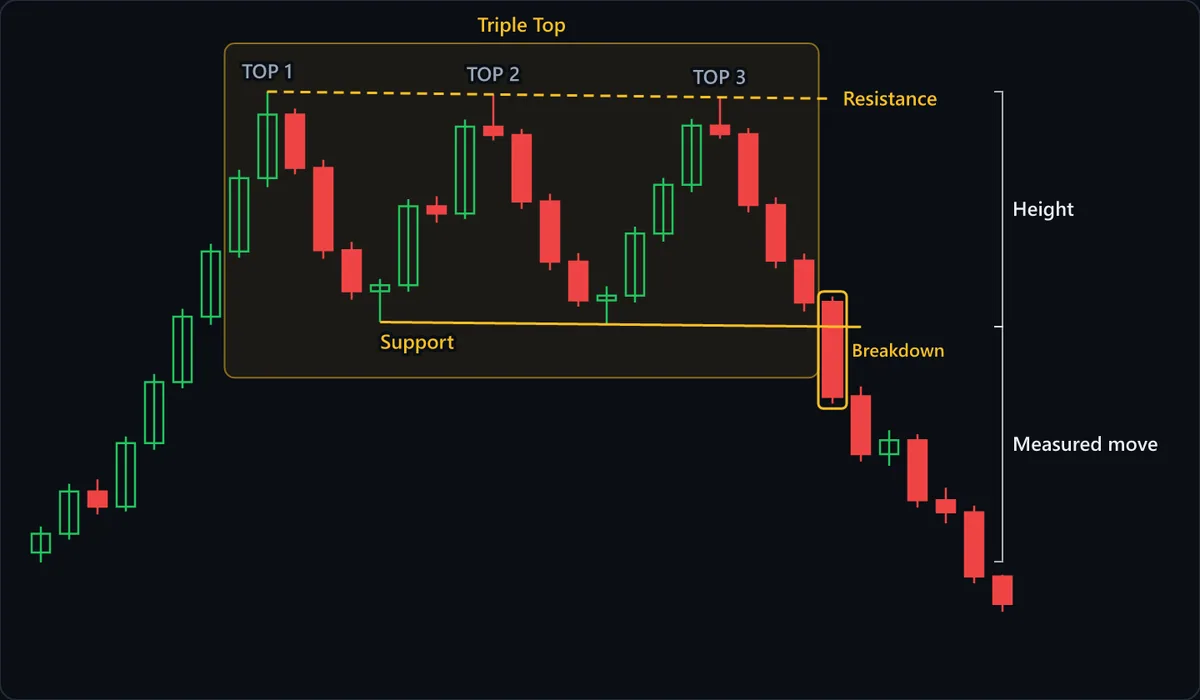
Chart data
| # | Open | High | Low | Close |
|---|---|---|---|---|
| 1 | 96.04 | 97.42 | 95.51 | 97.03 |
| 2 | 97.03 | 99.68 | 96.72 | 99.27 |
| 3 | 99.27 | 99.91 | 98.06 | 98.47 |
| 4 | 98.47 | 102.18 | 98.21 | 101.83 |
| 5 | 101.83 | 105.49 | 101.47 | 105.06 |
| 6 | 105.06 | 108.93 | 104.72 | 108.52 |
| 7 | 108.52 | 112.37 | 108.09 | 111.96 |
| 8 | 111.96 | 116.28 | 111.63 | 115.84 |
| 9 | 115.84 | 120.42 | 115.37 | 119.21 |
| 10 | 119.21 | 119.52 | 116.04 | 116.38 |
| 11 | 116.38 | 116.81 | 111.58 | 112.03 |
| 12 | 112.03 | 112.47 | 109.42 | 109.86 |
| 13 | 109.86 | 110.51 | 108.23 | 110.18 |
| 14 | 110.18 | 114.73 | 109.84 | 114.36 |
| 15 | 114.36 | 114.88 | 113.49 | 113.97 |
| 16 | 113.97 | 118.94 | 113.68 | 118.57 |
| 17 | 118.57 | 120.27 | 117.84 | 118.12 |
| 18 | 118.12 | 118.44 | 114.21 | 114.61 |
| 19 | 114.61 | 115.02 | 110.97 | 111.43 |
| 20 | 111.43 | 111.88 | 109.04 | 109.38 |
| 21 | 109.38 | 110.12 | 108.11 | 109.63 |
| 22 | 109.63 | 113.28 | 109.27 | 112.91 |
| 23 | 112.91 | 115.86 | 112.48 | 115.49 |
| 24 | 115.49 | 118.97 | 115.11 | 118.62 |
| 25 | 118.62 | 120.12 | 117.93 | 118.17 |
| 26 | 118.17 | 118.49 | 114.03 | 114.42 |
| 27 | 114.42 | 114.83 | 111.07 | 111.48 |
| 28 | 111.48 | 111.86 | 108.79 | 109.27 |
| 29 | 109.27 | 109.58 | 103.92 | 104.31 |
| 30 | 104.31 | 104.82 | 100.86 | 101.24 |
| 31 | 101.24 | 102.51 | 100.63 | 101.98 |
| 32 | 101.98 | 102.3 | 98.42 | 98.81 |
| 33 | 98.81 | 99.47 | 97.58 | 98.17 |
| 34 | 98.17 | 98.52 | 94.41 | 94.78 |
| 35 | 94.78 | 94.86 | 92.91 | 93.32 |
At a glance
| Type | Bearish reversal |
|---|---|
| Direction | Bearish |
| Bars required | Multiple bars |
| Family | Chart pattern |
| Evidence | Moderate |
| Also called | triple top pattern, triple top chart pattern, triple top formation, triple top reversal |
What timeframe does it work on?
Because it needs three separate rallies and two pullbacks, a triple top takes longer to build than a double top on any timeframe: weeks to months on a daily chart, several hours on a 15-minute chart. On very low timeframes three equal highs are often just the edge of an intraday range, so the prior uptrend and the support break carry more weight there.
Anatomy of the pattern
- Prior uptrend — The pattern only has something to reverse if price arrives from below after a sustained advance, as in the climb into TOP 1 on the chart. Three equal highs with no trend behind them are simply the ceiling of a sideways range.
- TOP 1, TOP 2, TOP 3 — Three peaks at roughly the same price, each rejected at the dashed resistance line. On the chart each top is a touch lower than the one before, which is common: buyers are reaching for the level with less conviction on every attempt.
- Support — The two troughs between the peaks settle at a similar price, and the line through them is the level the whole pattern hinges on. Until it breaks, every bearish reading is a forecast rather than a fact.
- Breakdown — A decisive close below support completes the pattern. On the chart the Breakdown candle opens just above support and closes well below it, about a third of the pattern's height lower, which is the kind of commitment that separates a break from a probe.
- Height and measured move — The distance from resistance down to support is the pattern's height. The conventional target subtracts that height from the breakout level, which is exactly what the two equal brackets on the right of the chart show.
How to identify it
- Price has been rising before the first peak, so there is an advance for the pattern to reverse.
- Three distinct highs cluster near one price; small differences are normal, but a clearly higher middle peak makes it a head and shoulders instead.
- Each peak is separated by a meaningful pullback, not just a few overlapping candles at the same level.
- The two troughs land near each other, so a roughly horizontal support line can be drawn through them. If the troughs differ, the stricter confirmation is a close below the lower of the two.
- Rallies into the second and third peaks show fading momentum, such as smaller candles, upper wicks or lighter volume.
- Price closes below the support line; until it does, you are looking at a range, not a completed triple top.
How to trade it
Entry. Sell on a close below the support formed by the two troughs (below the lower trough if they differ), or wait for the first retest of that broken level from below and sell when it fails to reclaim it. The close-below entry catches breaks that never look back, as on the chart; the retest entry offers a better price and a tighter stop but misses the breaks that do not return.
Stop. Above the highest of the three peaks. That ceiling is the premise of the trade: three rejections made the level meaningful, so price trading back above it means the supply that capped the rally has been absorbed. A stop just above support is tighter, but price has already crossed that zone repeatedly, so an ordinary retest can take it out.
Target. Measure the height from the peaks down to the support line and project it downward from the break. Because a triple top is usually wide, that target can be far away; check for prior swing lows or the base of the earlier advance on the way, since those often halt the decline first.
What invalidates it
- Price closes above the three peaks. The range resolved upward instead, and a ceiling that turned price away three times has now been absorbed, which undoes the entire bearish premise.
- Support never breaks and price keeps oscillating between the two lines. That is a horizontal range, and range tactics apply rather than a reversal trade.
- The breakdown closes back inside the pattern within a bar or two. A failed break of trough support often sends price back up toward the peaks.
- There was no meaningful advance before the first peak. Three highs inside an existing sideways market mark the top of that market, not the end of an uptrend.
Often confused with
Triple Top vs Double Top: what's the difference?
A double top fails at resistance twice and breaks support after a single trough; a triple top makes a third run at the same ceiling first. If price rallies back to the highs after what looked like a double top, do not short yet: the pattern is still forming.
Triple Top vs Head and Shoulders: what's the difference?
In a head and shoulders the middle peak clearly exceeds the two outer ones. In a triple top all three peaks reach about the same level, so the resistance line through them is roughly flat rather than bending around a taller head.
Triple Top vs Horizontal Channel: what's the difference?
A horizontal channel is the same box of roughly equal highs and lows, and it can form in any trend, even after an advance. It reads as a triple top only when it caps an uptrend with three tests of resistance and then closes below trough support. Until then, it is a channel that can break either way.
Triple Top vs Triple Bottom: what's the difference?
A triple top is the mirror image: three equal highs after an advance, confirmed by a close below the pullback lows. Check the trend that came before and which way the neckline breaks.
How reliable is the triple top pattern?
The triple top is a standard reversal in the classic chart-pattern references once support breaks, but it sits in the moderate tier rather than higher, mainly for definitional reasons. There is no agreed tolerance for how equal the three peaks must be, how deep the two pullbacks should go or how long the pattern may take, so results shift with the ruleset and with whether a close below support is required. It is also rarer than the double top, which leaves less evidence to judge it on, and before the break it is indistinguishable from a rectangle, a pattern that resolves in either direction. Its practical strength is clarity of levels: the trough line gives an objective trigger, and the highest peak gives a logical place to admit the read was wrong. Its weakness is width, because a stop above the peaks often sits far from the entry.
References
- Thomas N. Bulkowski. Encyclopedia of Chart Patterns . Wiley , 2005 . ISBN 978-0471668268.
- Robert D. Edwards, John Magee and W.H.C. Bassetti. Technical Analysis of Stock Trends . Routledge , 2018 . ISBN 978-1138069411.
Frequently asked questions
What does a triple top mean?
Is a triple top bullish or bearish?
How do you trade a triple top?
Does a triple top need confirmation?
What happens if a triple top fails?
Practise spotting the triple top
Reading about a pattern is not the same as recognising it under time pressure. Chart Guess drills 53 patterns as a 60-second game — read the chart, call BUY or SELL, get the pattern name instantly.