Triple Bottom Pattern
A triple bottom is a bullish reversal chart pattern in which a downtrend makes three lows at roughly the same price, separated by two rallies, and is confirmed only when price closes above the resistance line drawn through those rally highs.
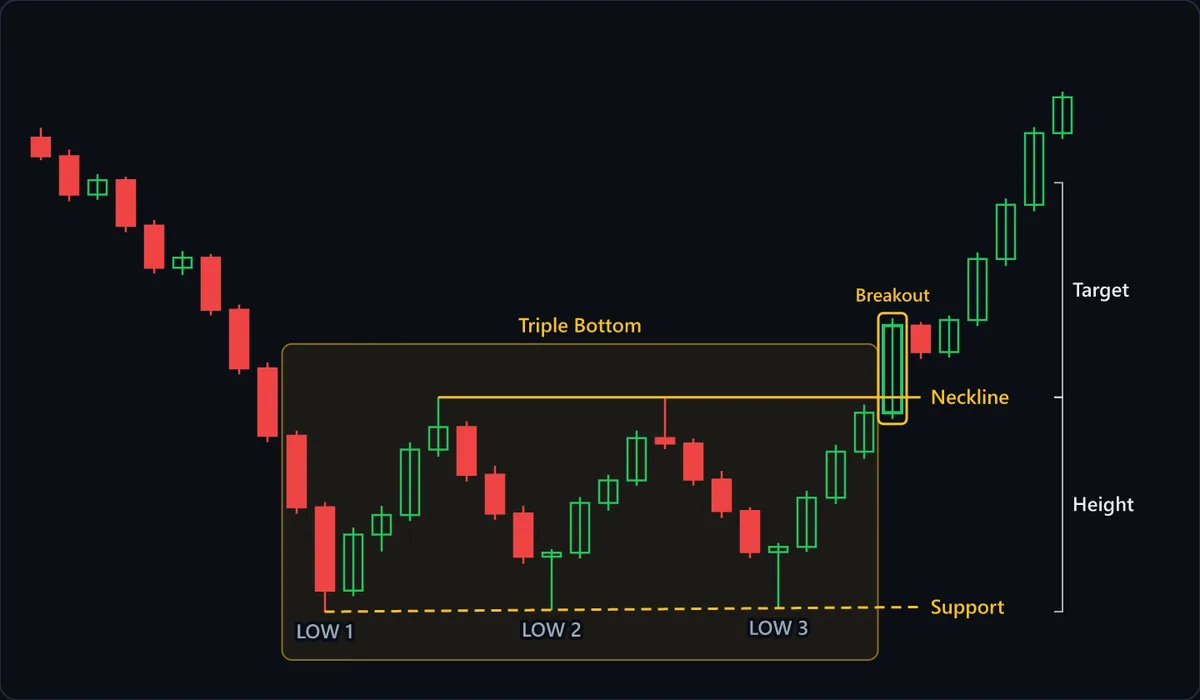
Chart data
| # | Open | High | Low | Close |
|---|---|---|---|---|
| 1 | 119.46 | 120.08 | 118.07 | 118.31 |
| 2 | 118.31 | 118.72 | 115.53 | 115.94 |
| 3 | 115.94 | 117.21 | 115.62 | 116.83 |
| 4 | 116.83 | 117.05 | 113.61 | 114.02 |
| 5 | 114.02 | 114.37 | 111.06 | 111.43 |
| 6 | 111.43 | 112.46 | 110.97 | 112.04 |
| 7 | 112.04 | 112.28 | 108.47 | 108.82 |
| 8 | 108.82 | 109.15 | 104.83 | 105.21 |
| 9 | 105.21 | 105.57 | 100.64 | 101.03 |
| 10 | 101.03 | 101.36 | 96.21 | 96.62 |
| 11 | 96.62 | 96.94 | 90.16 | 91.47 |
| 12 | 91.47 | 95.36 | 91.12 | 94.93 |
| 13 | 94.93 | 96.71 | 93.88 | 96.14 |
| 14 | 96.14 | 100.63 | 95.77 | 100.18 |
| 15 | 100.18 | 103.42 | 99.74 | 101.57 |
| 16 | 101.57 | 101.93 | 98.21 | 98.62 |
| 17 | 98.62 | 99.18 | 95.84 | 96.23 |
| 18 | 96.23 | 96.71 | 93.12 | 93.56 |
| 19 | 93.56 | 94.03 | 90.27 | 93.81 |
| 20 | 93.81 | 97.24 | 93.45 | 96.88 |
| 21 | 96.88 | 98.62 | 96.41 | 98.27 |
| 22 | 98.27 | 101.36 | 97.94 | 100.89 |
| 23 | 100.89 | 103.42 | 100.21 | 100.56 |
| 24 | 100.56 | 100.87 | 97.96 | 98.33 |
| 25 | 98.33 | 98.87 | 95.94 | 96.38 |
| 26 | 96.38 | 96.62 | 93.47 | 93.84 |
| 27 | 93.84 | 94.41 | 90.38 | 94.17 |
| 28 | 94.17 | 97.63 | 93.86 | 97.21 |
| 29 | 97.21 | 100.48 | 96.82 | 100.05 |
| 30 | 100.05 | 102.97 | 99.61 | 102.46 |
| 31 | 102.46 | 108.31 | 102.08 | 107.84 |
| 32 | 107.84 | 108.06 | 105.79 | 106.21 |
| 33 | 106.21 | 108.47 | 105.88 | 108.19 |
| 34 | 108.19 | 112.36 | 107.82 | 111.97 |
| 35 | 111.97 | 115.71 | 111.53 | 115.31 |
| 36 | 115.31 | 120.12 | 114.91 | 119.74 |
| 37 | 119.74 | 122.31 | 119.38 | 121.96 |
At a glance
| Type | Bullish reversal |
|---|---|
| Direction | Bullish |
| Bars required | Multiple bars |
| Family | Chart pattern |
| Evidence | Moderate |
| Also called | triple bottom pattern, triple bottom formation, triple bottom chart pattern |
What timeframe does it work on?
The triple bottom is defined by price levels, not candle shapes, so it can appear on any timeframe, but it needs room. Three tests of support plus two rallies take many bars, and on intraday charts a flat stretch with three similar lows is often just a quiet range. The classic references describe it on daily and weekly charts after an extended decline, where the time spent building the base is part of what makes the reversal case.
Anatomy of the pattern
- The prior decline — A clear downtrend must come first, as in the falling candles on the left of the chart. Three equal lows in a market that was already going sideways describe a range, and a range has nothing to reverse.
- LOW 1, LOW 2, LOW 3 — Three lows that stop at about the same price, marked by the dashed support line. LOW 3 in the chart is a long lower wick that closes back near its open: sellers pushed into the floor once more and were absorbed again.
- The neckline — The resistance line through the highs of the two rallies between the lows. In the chart both rallies stall at the same level, and the second one leaves a long upper wick, showing that sellers still defended that line before the breakout.
- The breakout — The highlighted candle closes well above the neckline. That close completes the pattern. Until it happens, the shaded box is only a sideways range that could still break down through support.
- Height and target — The Height bracket measures from the support line to the neckline. The Target bracket adds that same distance above the neckline, the conventional measured objective for the pattern.
How to identify it
- A downtrend precedes the pattern; you can point to a sequence of lower highs and lower lows ending at LOW 1.
- Three distinct lows sit at roughly the same level. They do not need to be exact, but none should break meaningfully below the others.
- Two rallies separate the lows and reach a similar height, so a neckline through them is close to horizontal.
- The rallies between lows are substantial relative to the pattern, not a few bars of noise inside a flat range.
- Selling pressure fades into the later lows; volume, where available, tends to shrink on each test and expand on the breakout.
- The pattern is confirmed only by a close above the neckline, not by the third low holding.
How to trade it
Entry. Buy on a close above the neckline, or wait for price to pull back to the neckline and hold it as support. In the chart the small red candle after the breakout only pauses well above the neckline, so this example gives no retest entry. Buying inside the base anticipates a breakout that may never come and can mean weeks of chop between support and the neckline.
Stop. Below the lowest of the three lows. That floor is the whole premise of the pattern: three times buyers stopped the decline there, so a close beneath it means they are no longer defending it. The stop is wide because the base is wide, which is why position size matters more than usual here.
Target. Measure the height from the support line to the neckline and project it upward from the neckline (the breakout level). Treat it as a reference, not a promise; a prior swing high from the decline that preceded the pattern often caps the move before the projection is reached.
What invalidates it
- A close below the three lows. The support that defined the pattern has failed, and the base becomes a continuation of the downtrend.
- Price closes above the neckline, then falls back inside the base within a few bars. A failed breakout returns the setup to an unresolved range.
- Each low is clearly lower than the last. Stepping lows are an ongoing decline, not a floor being defended.
- The rallies reach the neckline but price keeps cycling back to support without ever closing above it. Until that close, there is no triple bottom, only a range.
Often confused with
Triple Bottom vs Descending Triangle: what's the difference?
Both show three tests of the same low. In a triple bottom the rallies between tests reach roughly the same height and the pattern resolves upward through them; when each rally off the floor is weaker than the last, the floor is being worn down, not confirmed.
Triple Bottom vs Double Bottom: what's the difference?
A double bottom confirms after two lows and one rally high; a triple bottom needs a third test of support first. If the rally after the second low stalls near the first rally high without closing above it and price returns to the lows, a triple bottom may be forming.
Triple Bottom vs Horizontal Channel: what's the difference?
A horizontal channel is a range that can form in any trend, usually with more touches of both boundaries, and often breaks out in the direction of the prior trend. Three touches of support become a triple bottom only after a downtrend, with two clear rallies between them and a close above the top.
Triple Bottom vs Inverse Head and Shoulders: what's the difference?
A triple bottom has three lows at roughly the same price. In an inverse head and shoulders the middle low clearly undercuts both shoulders. If you cannot point to a head that is distinctly lower, treat it as a triple bottom.
Triple Bottom vs Triple Top: what's the difference?
A triple top is the mirror image: three equal highs after an advance, confirmed by a close below the pullback lows. Check the trend that came before and which way the neckline breaks.
How reliable is the triple bottom pattern?
The triple bottom is covered in the classic chart-pattern references and is treated as a meaningful reversal once it is confirmed, which places it in the moderate tier. The limiting factor is definition: there is no agreed tolerance for how equal the three lows must be, how high the rallies between them should reach or how long the base may last, and published results shift with those choices and with whether a close above the neckline is required. It is also far less common than the double bottom, and many three-low ranges never break upward at all. Its practical strength is that both decision levels are objective: the neckline gives a clear trigger and the support line gives a clear point of failure. Its practical weakness is the distance between them, which makes the stop wide.
References
- Thomas N. Bulkowski. Encyclopedia of Chart Patterns . Wiley , 2005 . ISBN 978-0471668268.
- Robert D. Edwards, John Magee and W.H.C. Bassetti. Technical Analysis of Stock Trends . Routledge , 2018 . ISBN 978-1138069411.
Frequently asked questions
What does a triple bottom mean?
Is a triple bottom bullish or bearish?
How do you trade a triple bottom?
Does a triple bottom need confirmation?
What is the difference between a triple bottom and a triple top?
Practise spotting the triple bottom
Reading about a pattern is not the same as recognising it under time pressure. Chart Guess drills 53 patterns as a 60-second game — read the chart, call BUY or SELL, get the pattern name instantly.