Inverse Head and Shoulders Pattern
An inverse head and shoulders is a bullish reversal pattern that forms after a downtrend: three troughs, with the middle one (the head) the lowest, and a neckline across the two rally highs between them that price must close above to confirm the bottom.
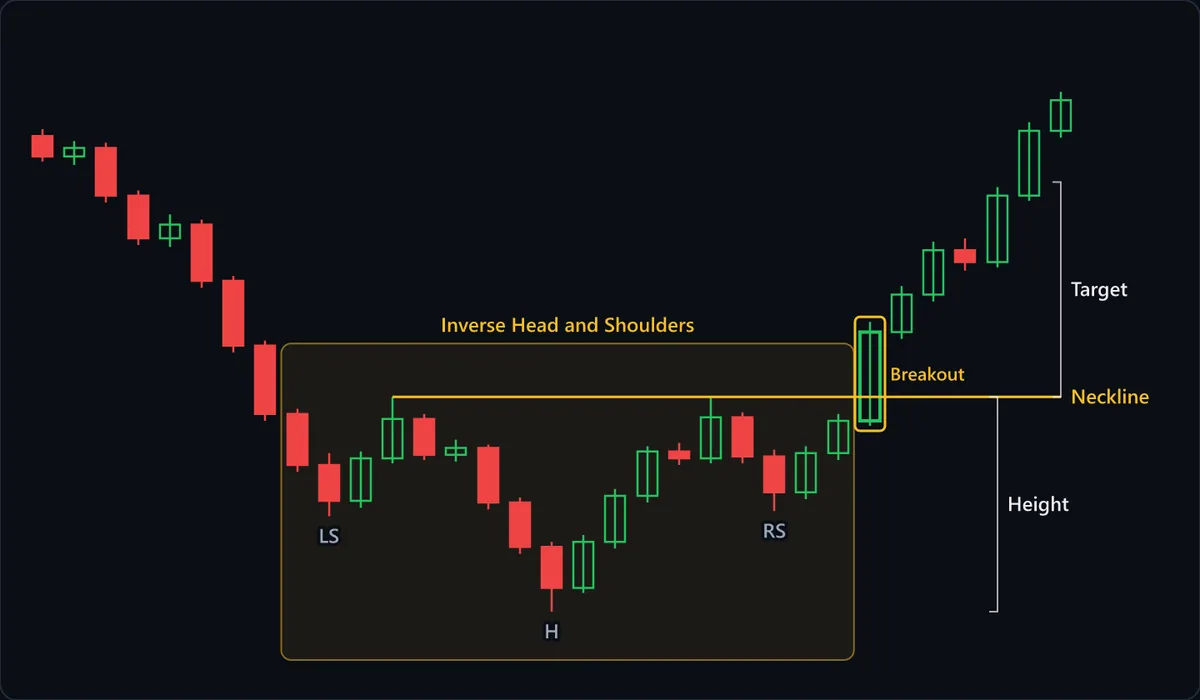
Chart data
| # | Open | High | Low | Close |
|---|---|---|---|---|
| 1 | 116.1 | 116.5 | 114.6 | 114.9 |
| 2 | 114.9 | 115.8 | 114.4 | 115.4 |
| 3 | 115.4 | 115.7 | 112.2 | 112.6 |
| 4 | 112.6 | 112.9 | 109.7 | 110.1 |
| 5 | 110.1 | 111.5 | 109.6 | 110.9 |
| 6 | 110.9 | 111.2 | 107.2 | 107.6 |
| 7 | 107.6 | 107.9 | 103.4 | 103.8 |
| 8 | 103.8 | 104.1 | 99.4 | 99.8 |
| 9 | 99.8 | 100.1 | 96.4 | 96.8 |
| 10 | 96.8 | 97.5 | 93.8 | 94.7 |
| 11 | 94.7 | 97.6 | 94.3 | 97.2 |
| 12 | 97.2 | 100.8 | 96.9 | 99.5 |
| 13 | 99.5 | 99.8 | 97.1 | 97.4 |
| 14 | 97.4 | 98.3 | 97 | 97.8 |
| 15 | 97.8 | 98 | 94.2 | 94.6 |
| 16 | 94.6 | 94.9 | 91.6 | 92 |
| 17 | 92 | 92.3 | 88.2 | 89.6 |
| 18 | 89.6 | 92.7 | 89.3 | 92.3 |
| 19 | 92.3 | 95.4 | 91.9 | 95 |
| 20 | 95 | 97.9 | 94.6 | 97.6 |
| 21 | 97.6 | 98.1 | 96.8 | 97.2 |
| 22 | 97.2 | 100.8 | 96.9 | 99.6 |
| 23 | 99.6 | 99.9 | 96.9 | 97.3 |
| 24 | 97.3 | 97.7 | 94.1 | 95.2 |
| 25 | 95.2 | 97.9 | 94.8 | 97.5 |
| 26 | 97.5 | 99.8 | 97.1 | 99.4 |
| 27 | 99.4 | 105.2 | 99.1 | 104.6 |
| 28 | 104.6 | 107.3 | 104.2 | 106.8 |
| 29 | 106.8 | 109.9 | 106.4 | 109.4 |
| 30 | 109.4 | 110.1 | 108.2 | 108.7 |
| 31 | 108.7 | 113.1 | 108.4 | 112.6 |
| 32 | 112.6 | 116.9 | 112.3 | 116.4 |
| 33 | 116.4 | 118.7 | 116 | 118.2 |
At a glance
| Type | Bullish reversal |
|---|---|
| Direction | Bullish |
| Bars required | Multiple bars |
| Family | Chart pattern |
| Evidence | Well documented |
| Also called | head and shoulders bottom, reverse head and shoulders, inverted head and shoulders, inverse H&S |
What timeframe does it work on?
The pattern appears on intraday, daily and weekly charts, but it needs room: three declines and two rallies take dozens of bars, so on a 1-minute chart the shape is often just chop. It carries the most weight on daily and weekly charts after a long decline, where each trough is real selling being absorbed. The shoulders should take comparable time; a right shoulder built far faster than the left is suspect.
Anatomy of the pattern
- Prior downtrend — There has to be a decline to reverse. In the chart, price falls from the 116 area for about ten bars before any structure appears. Without that slide, three troughs are just a range.
- Left shoulder (LS) — The first trough of the base, followed by a rally to what becomes the neckline. On its own it is just a bounce inside a downtrend; it becomes a shoulder only once the head and right shoulder form.
- Head (H) — Sellers push to a new, lower low and it is bought back to the same rally high as before. This is the capitulation leg; when it comes on a volume spike, it says sellers emptied out rather than paused.
- Right shoulder (RS) — The next decline stops well above the head, roughly level with the left shoulder. A higher low after a lower low is the first evidence that selling pressure is drying up.
- Neckline and breakout — The line joining the two rally highs between the troughs. Here it is flat at about 100.80, and the marked Breakout candle closes well above it. The close beyond the neckline is what turns a possible bottom into a confirmed one.
- Height and target — The Height bracket measures from the head's low to the neckline. The Target bracket repeats that distance upward from the neckline at the breakout point, giving the conventional measured objective.
How to identify it
- A clear downtrend precedes the formation; the head should be a new low for the move, not a dip inside a sideways range.
- There are three distinct troughs, with the middle one clearly lower than both shoulders.
- The right shoulder holds above the head's low, and ideally sits near the level of the left shoulder.
- You can draw a neckline through the two rally highs between the troughs; flat or gently rising is classic, steeply falling is weaker.
- Volume, where visible, tends to be heavy at the head's low and expands again on the neckline break.
- Confirmation is a candle close above the neckline, not a wick that pokes through and closes back underneath.
How to trade it
Entry. Buy on a candle close above the neckline, or wait for a pullback that tests the neckline from above and holds it as support. Waiting for the neckline matters because many right shoulders roll over before reaching it, and waiting for a close matters because wicks through the neckline often fail; the retest entry gives a better price but is missed when breakouts run without looking back.
Stop. Below the right shoulder's low. That higher low is what made the pattern; if price falls back beneath it, sellers have regained the ground the pattern says they lost. A stop under the head is less likely to be hit, but it sits about one full pattern height below the entry, as far away as the measured target, so the reward-to-risk falls to roughly 1:1.
Target. Take the height from the head's low to the neckline and project it upward from the neckline at the breakout. It is a convention, not a promise: resistance left by congestion or broken support from earlier in the decline often stalls price before the projection.
What invalidates it
- Price closes back below the neckline after the breakout. A bottom that cannot hold its own neckline was never confirmed, and a failed breakout can drop back toward the right shoulder.
- Price drops below the right shoulder's low before any breakout. The higher low that defined the pattern is gone.
- The right shoulder undercuts the head. Then there is no head, only a continuing series of lower lows.
- The breakout comes on weak volume and stalls immediately. Without fresh buying and short covering, the neckline break tends not to last.
- There was no meaningful decline before it. Inside a sideways range, three troughs are just the floor of the range being tested.
Often confused with
Inverse Head and Shoulders vs Diamond Bottom: what's the difference?
Both show a lowest low in the middle between two higher lows. In an inverse head and shoulders the rebound highs form a roughly level neckline; in a diamond bottom the highs rise into the middle and fall away, so the trigger line slopes down.
Inverse Head and Shoulders vs Double Bottom: what's the difference?
A double bottom has two troughs at about the same level with one peak between them. The inverse head and shoulders adds a third trough and a second rally high, and the deeper middle low is what defines it.
Inverse Head and Shoulders vs Head and Shoulders: what's the difference?
The same structure flipped: a head and shoulders forms three peaks with the highest in the middle after an uptrend and breaks down through its neckline. The inverse version has three troughs with the lowest in the middle after a downtrend and breaks up. Check which way the head points.
Inverse Head and Shoulders vs Triple Bottom: what's the difference?
A triple bottom has three lows at roughly the same price. In an inverse head and shoulders the middle low clearly undercuts both shoulders. If you cannot point to a head that is distinctly lower, treat it as a triple bottom.
How reliable is the inverse head and shoulders pattern?
The inverse head and shoulders sits in the well-documented tier for the same reason as its bearish mirror: it is a classic reversal formation in the standard chart-pattern references, and its parts (a lower middle trough, a neckline, a close beyond it) are objective enough to be tested algorithmically, which academic work has done. That shows the pattern is definable and studied, not that it works on any given chart. Published results depend on the rules chosen: how symmetric the shoulders must be, how much the neckline may slope, and whether a close or a touch counts as the breakout. Many shapes labelled inverse head and shoulders fail a strict definition, usually because there was no real prior decline or the head is barely lower than the shoulders. Its practical strength is a clear failure point: a close back below the neckline tells you quickly that the bottom has not held.
References
- Thomas N. Bulkowski. Encyclopedia of Chart Patterns . Wiley , 2005 . ISBN 978-0471668268.
- Robert D. Edwards, John Magee and W.H.C. Bassetti. Technical Analysis of Stock Trends . Routledge , 2018 . ISBN 978-1138069411.
- Andrew W. Lo, Harry Mamaysky and Jiang Wang. Foundations of Technical Analysis: Computational Algorithms, Statistical Inference, and Empirical Implementation . The Journal of Finance , 2000 .
Frequently asked questions
What does an inverse head and shoulders mean?
Is an inverse head and shoulders bullish or bearish?
Does an inverse head and shoulders need confirmation?
What happens after an inverse head and shoulders?
How reliable is the inverse head and shoulders?
Practise spotting the inverse head and shoulders
Reading about a pattern is not the same as recognising it under time pressure. Chart Guess drills 53 patterns as a 60-second game — read the chart, call BUY or SELL, get the pattern name instantly.