Bullish Wolfe Wave Pattern
A bullish Wolfe wave is a five-point reversal pattern inside a falling wedge: the fifth wave dips briefly below the line through points 1 and 3, then turns up, and the target is a rising line drawn from point 1 through point 4.
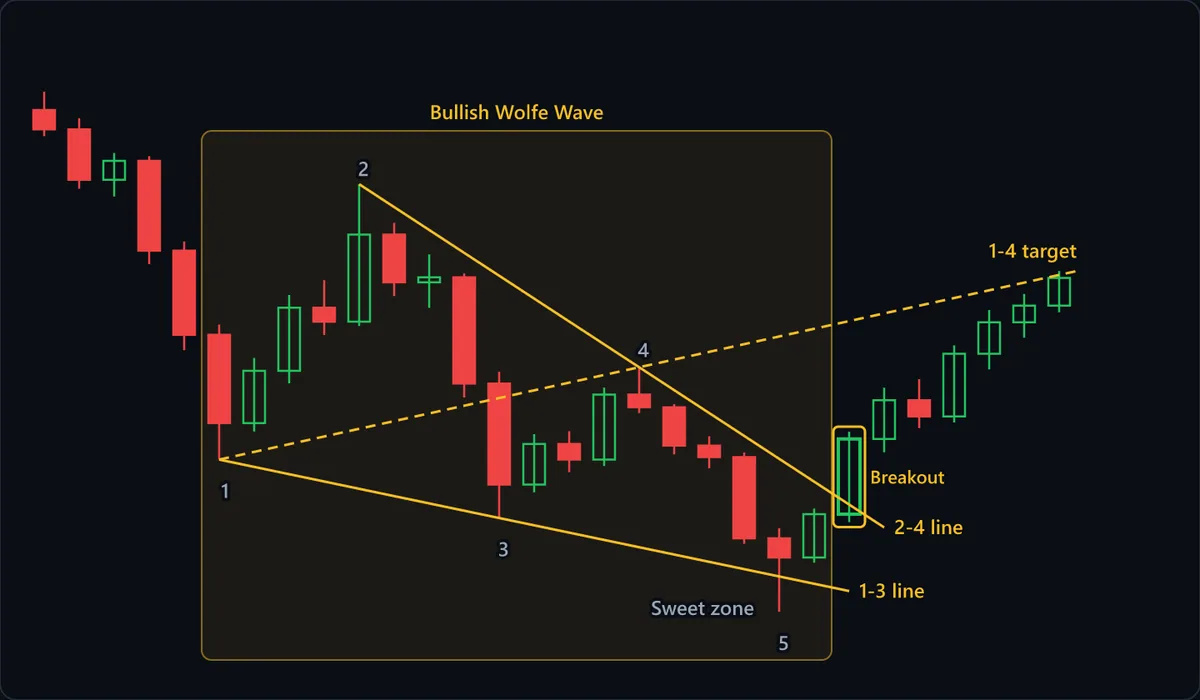
Chart data
| # | Open | High | Low | Close |
|---|---|---|---|---|
| 1 | 119.28 | 120.08 | 118.13 | 118.43 |
| 2 | 118.43 | 118.92 | 115.84 | 116.23 |
| 3 | 116.23 | 117.4 | 115.5 | 117.06 |
| 4 | 117.06 | 117.27 | 112.55 | 113.14 |
| 5 | 113.14 | 113.54 | 108.79 | 109.47 |
| 6 | 109.47 | 109.91 | 104.02 | 105.61 |
| 7 | 105.61 | 108.46 | 105.25 | 107.89 |
| 8 | 107.89 | 111.2 | 107.35 | 110.65 |
| 9 | 110.65 | 111.85 | 109.46 | 110.04 |
| 10 | 110.04 | 116.04 | 109.85 | 113.84 |
| 11 | 113.84 | 114.35 | 111.16 | 111.76 |
| 12 | 111.76 | 112.98 | 110.64 | 111.98 |
| 13 | 111.98 | 112.14 | 106.73 | 107.34 |
| 14 | 107.34 | 107.85 | 101.47 | 102.93 |
| 15 | 102.93 | 105.13 | 102.59 | 104.7 |
| 16 | 104.7 | 105.26 | 103.47 | 104.02 |
| 17 | 104.02 | 107.17 | 103.74 | 106.86 |
| 18 | 106.86 | 108.05 | 106.05 | 106.3 |
| 19 | 106.3 | 106.44 | 104.25 | 104.63 |
| 20 | 104.63 | 105.04 | 103.64 | 104.13 |
| 21 | 104.13 | 104.33 | 100.35 | 100.58 |
| 22 | 100.58 | 101.03 | 97.38 | 99.75 |
| 23 | 99.75 | 101.88 | 99.52 | 101.64 |
| 24 | 101.64 | 105.24 | 101.29 | 104.92 |
| 25 | 104.92 | 107.16 | 104.34 | 106.61 |
| 26 | 106.61 | 107.53 | 105.39 | 105.9 |
| 27 | 105.9 | 109 | 105.64 | 108.64 |
| 28 | 108.64 | 110.55 | 107.96 | 110.01 |
| 29 | 110.01 | 111.25 | 109.34 | 110.74 |
| 30 | 110.74 | 112.25 | 110.45 | 111.95 |
At a glance
| Type | Bullish reversal |
|---|---|
| Direction | Bullish |
| Bars required | Multiple bars |
| Family | Chart pattern |
| Evidence | Weak |
| Also called | bullish wolfe wave pattern, wolfe wave bottom, bullish wolf wave |
What timeframe does it work on?
The pattern needs four clean swings before point 5 exists, so it reads best on hourly charts and above, where each wave spans several bars. On very low timeframes the swings are often one-bar noise and choosing point 1 or point 3 becomes guesswork. On any timeframe, a fifth wave that arrives far sooner or later than the earlier rhythm is a weaker fit.
Anatomy of the pattern
- Points 1 to 4 — Alternating swings: 1 is a low after a decline, 2 the rally high, 3 a lower low, 4 a lower high. Point 4 should rally back above the point-1 low, as on this chart, so the swings stay in proportion.
- 1-3 line — The lower boundary, drawn through the two lows and extended forward. It marks where sellers have been running out of push, and it is the line wave 5 has to break slightly for the pattern to be complete.
- 2-4 line — The upper boundary through the two highs. It falls more steeply than the 1-3 line, so the range narrows. A close back above it, like the highlighted breakout candle, is the later and more conservative confirmation.
- Sweet zone (point 5) — The area just below the extended 1-3 line where wave 5 should end. The undercut is the point of the pattern: stops under obvious support get triggered and late sellers pile in, then price recovers back above the line.
- 1-4 target — A line from point 1 through point 4, extended to the right. With point 4 above the point-1 low, as the identification rules require, the line slopes upward, so the target rises the longer the move takes, so it is read off the line at the bar where price reaches it rather than fixed in advance.
How to identify it
- A decline leads into the structure, and point 1 is a clear swing low inside it, with point 2 the rally high that follows.
- Point 3 is lower than point 1 and point 4 is lower than point 2, so both boundaries slope downward.
- The 2-4 line falls faster than the 1-3 line and the two converge, rather than running parallel as a channel would.
- Point 4 rallies back into the range of wave 1, above the point-1 low, which keeps the waves proportional.
- Wave 5 pushes slightly below the extended 1-3 line and stalls there; a candle that wicks under the line and closes back above it is the clearest version.
- The swings are roughly similar in size and duration. If you have to stretch to make the points fit, they do not fit.
How to trade it
Entry. The aggressive entry is at point 5, buying as price turns up from the sweet zone. The steadier version waits for a close back above the 1-3 line, showing the undercut was rejected. Waiting for a close above the 2-4 line confirms more but often gives up much of the distance to the 1-4 target.
Stop. Below the point-5 low. That low is the trap the pattern depends on, the level where the last sellers were flushed out. If price trades through it again, the undercut was a real breakdown and the setup is gone. Because point 5 sits just under the 1-3 line, this stop is usually close to entry.
Target. The 1-4 line, extended forward and read when price reaches it. Because the line rises with time, a fast rally meets it lower and a slow one higher, so a single price fixed at entry ignores the slope. Check prior swing highs on the way, since point 2 or point 4 can stall the move first.
What invalidates it
- Price keeps falling below point 5 without turning. The dip under the 1-3 line was a genuine breakdown of the wedge, and the stop below the point-5 low exists for exactly this.
- Wave 5 never reaches the 1-3 line and turns up early. Without the overshoot there is no trap and no sweet zone, so this is at most an ordinary falling wedge to be traded on its own rules.
- The undercut goes far below the 1-3 line. A deep break looks like sellers taking control rather than a brief stop-run, and it pushes the stop so far away that the risk to the 1-4 line no longer works.
- The boundaries run parallel or widen. That is a descending channel or a broadening shape, and the five-point numbering gives no valid 1-4 target.
- The points only fit when you skip obvious swings or pick wicks selectively. Forcing a Wolfe wave onto an uneven structure is an easy way to misread this pattern.
Often confused with
Bullish Wolfe Wave vs Bearish Wolfe Wave: what's the difference?
The mirror image: a falling wedge whose fifth wave undercuts the 1-3 line of lower lows and snaps back up. If the numbered points are descending and point 5 is a low, it is the bullish version.
Bullish Wolfe Wave vs Descending Channel: what's the difference?
A descending channel has roughly parallel boundaries, so a close below the lower line is a breakdown. A bullish Wolfe wave needs the 2-4 line falling faster than the 1-3 line, so the range narrows before point 5 dips briefly under it.
Bullish Wolfe Wave vs Falling Wedge: what's the difference?
A falling wedge is normally bought on a close above its upper line, and its final low can stay inside the wedge. A bullish Wolfe wave needs wave 5 to pierce the lower 1-3 line and recover, and it targets the rising 1-4 line rather than the wedge's starting level.
How reliable is the bullish wolfe wave pattern?
This page rates the bullish Wolfe wave as weak because of where it comes from. It is a practitioner method associated with trader Bill Wolfe, not part of the classic chart-pattern canon. It does not appear among the classic formations in Edwards and Magee, and it was not one of the ten patterns Lo, Mamaysky and Wang tested algorithmically. That means little independent evidence either way, which is different from evidence that it fails. The second problem is subjectivity. Choosing point 1, deciding how far below the 1-3 line still counts as the sweet zone, and judging symmetry are all judgment calls, and each one moves the 1-4 target. Two traders can number the same decline differently, so no success rate means anything without the exact rules. What is concrete is the risk: a stop just under the point-5 low.
Frequently asked questions
What does a bullish Wolfe wave mean?
Is a bullish Wolfe wave bullish or bearish?
How do you trade a bullish Wolfe wave?
What is the sweet zone in a Wolfe wave?
How reliable is the bullish Wolfe wave?
Practise spotting the bullish wolfe wave
Reading about a pattern is not the same as recognising it under time pressure. Chart Guess drills 53 patterns as a 60-second game — read the chart, call BUY or SELL, get the pattern name instantly.