Diamond Bottom Chart Pattern
A diamond bottom is a bullish reversal pattern that forms after a decline: price swings first widen into lower lows and higher highs, then narrow into higher lows and lower highs, and the pattern completes when price closes above the upper-right boundary.
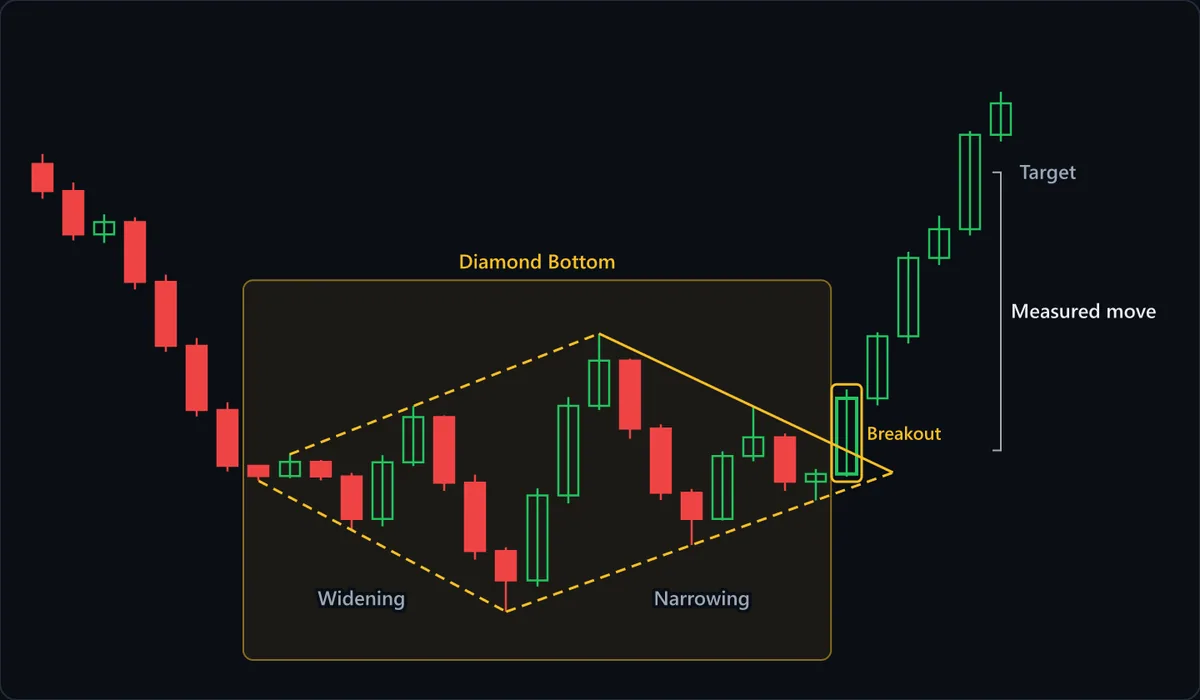
Chart data
| # | Open | High | Low | Close |
|---|---|---|---|---|
| 1 | 117.42 | 117.95 | 115.57 | 115.98 |
| 2 | 115.98 | 116.43 | 113.35 | 113.68 |
| 3 | 113.68 | 114.74 | 113.22 | 114.33 |
| 4 | 114.33 | 114.58 | 110.75 | 111.15 |
| 5 | 111.15 | 111.54 | 107.42 | 107.74 |
| 6 | 107.74 | 108.17 | 103.99 | 104.33 |
| 7 | 104.33 | 104.74 | 101.06 | 101.36 |
| 8 | 101.36 | 101.38 | 100.56 | 100.82 |
| 9 | 100.82 | 101.97 | 100.71 | 101.57 |
| 10 | 101.57 | 101.67 | 100.58 | 100.8 |
| 11 | 100.8 | 100.99 | 97.95 | 98.54 |
| 12 | 98.54 | 101.93 | 98.15 | 101.55 |
| 13 | 101.55 | 104.54 | 101.35 | 103.95 |
| 14 | 103.95 | 104.04 | 100.03 | 100.46 |
| 15 | 100.46 | 100.9 | 96.37 | 96.83 |
| 16 | 96.83 | 97.03 | 93.6 | 95.27 |
| 17 | 95.27 | 100.17 | 94.94 | 99.79 |
| 18 | 99.79 | 105.02 | 99.37 | 104.55 |
| 19 | 104.55 | 108.4 | 104.33 | 106.96 |
| 20 | 106.96 | 107.06 | 102.8 | 103.35 |
| 21 | 103.35 | 103.57 | 99.54 | 99.93 |
| 22 | 99.93 | 100.13 | 97.15 | 98.54 |
| 23 | 98.54 | 102.14 | 98.46 | 101.88 |
| 24 | 101.88 | 104.51 | 101.6 | 102.88 |
| 25 | 102.88 | 103.08 | 100.03 | 100.52 |
| 26 | 100.52 | 101.2 | 99.52 | 100.93 |
| 27 | 100.93 | 105.43 | 100.78 | 104.95 |
| 28 | 104.95 | 108.47 | 104.57 | 108.26 |
| 29 | 108.26 | 112.76 | 107.87 | 112.42 |
| 30 | 112.42 | 114.67 | 112.04 | 113.95 |
| 31 | 113.95 | 119.17 | 113.62 | 118.97 |
| 32 | 118.97 | 121.27 | 118.62 | 120.65 |
At a glance
| Type | Bullish reversal |
|---|---|
| Direction | Bullish |
| Bars required | Multiple bars |
| Family | Chart pattern |
| Evidence | Moderate |
| Also called | diamond bottom pattern, bullish diamond pattern, diamond bottom chart pattern |
What timeframe does it work on?
Diamond bottoms carry the most weight on daily and weekly charts, where the volatile left half reflects days of real capitulation and the right half a genuine cooling-off. On intraday charts, four lines can be fitted around almost any choppy stretch, so the shape is easy to find and hard to trust. Needing two full swing structures, a diamond also forms more slowly than a triangle.
Anatomy of the pattern
- The prior decline — The pattern needs something to reverse. On this chart a run of red candles carries price from the 117 area down to about 101 before the first swing appears. Without that selloff, a diamond-shaped range is just a range.
- Widening — The left half broadens. The swing lows step down from about 100.6 to 98 to 93.6 while the rebound highs climb from about 102 to an earlier high near 104.5 and then to 108.4. Sellers can still force new lows, but buyers answer each one harder.
- Narrowing — After the widest point the swings contract. The next lows hold near 97 and then 99.5, while the highs fall from 108.4 to a later, separate high near 104.5. Sellers who reached 93.6 can no longer get back near it.
- Upper-right trendline — The solid line from the 108.4 peak through the 104.5 high is the trigger. It slopes down, so the breakout level drops the longer the diamond takes to resolve.
- Breakout — The marked candle opens near 101 and closes near 105, above the upper-right line and near its own high. A close through the line, not a wick poking past it, is what completes the pattern.
- Measured move — The bracket takes the diamond's widest height, the 93.6 low to the 108.4 high or about 14.8 points, and adds it to the upper-right line's level at the break, about 102. That puts the target near 117, which this example reaches four candles after the break.
How to identify it
- A clear decline comes first, and the diamond's first swing starts near the bottom of that move.
- The left half shows at least two lower lows and two higher highs, so its boundaries diverge.
- The right half shows at least two higher lows and at least one lower high after the widest point, so its boundaries converge toward a point.
- The widest vertical distance sits near the middle, giving a wide center with pointed ends rather than a flat side.
- The structure's lowest low is in the middle of the formation, not at its right edge.
- The trigger is a candle closing above the upper-right trendline, ideally with volume expanding on that break.
How to trade it
Entry. Buy on a close above the upper-right trendline, the line joining the falling highs of the narrowing half, or on a pullback that holds that line from above. Buying during the widening half means betting on a resolution the pattern has not given yet: at that stage the left side cannot be told apart from a broadening bottom that keeps falling.
Stop. Below the last swing low in the contracting half, which on this chart is the low near 99.5 just before the breakout. That higher low is the evidence that sellers lost the power to revisit the diamond's floor, and a move beneath it erases the evidence. A stop under the 93.6 low is safer but usually too far away for the target to justify.
Target. Add the diamond's widest height, from its lowest low to its highest high in the middle, to the price where the upper-right trendline is broken. Diamonds are wide relative to most consolidations, so this projection can be ambitious; check the swing highs left behind during the prior decline, because those are where sellers from the selloff often reappear.
What invalidates it
- A close below the lower-right trendline. The narrowing half resolving downward turns the formation into a pause within the decline, and the case for a bottom is gone.
- A new low inside the narrowing half. If price undercuts the previous swing low there, the right half is no longer contracting and the higher-low evidence behind the stop is gone; if it also breaks the diamond's lowest low (93.6 here), the swings are still widening and the formation is a broadening pattern rather than a diamond.
- A breakout that closes back below the upper-right line within a few candles. The boundaries are hand-drawn and can be off slightly, so a quick return inside says the break was too marginal to rely on.
- No broadening section. If the left half never actually widened, the shape is a symmetrical triangle with an extra line on it, and the diamond's widest-height target does not apply.
Often confused with
Diamond Bottom vs Broadening Bottom: what's the difference?
A broadening bottom keeps widening until it breaks; a diamond bottom widens and then contracts. If the latest swings are still making lower lows and higher highs, the diamond's right half, and its trigger line, does not exist yet.
Diamond Bottom vs Inverse Head and Shoulders: what's the difference?
Both show a lowest low in the middle between two higher lows. In an inverse head and shoulders the rebound highs form a roughly level neckline; in a diamond bottom the highs rise into the middle and fall away, so the trigger line slopes down.
Diamond Bottom vs Symmetrical Triangle: what's the difference?
A diamond's right half looks like a symmetrical triangle, but a triangle starts wide and only narrows. Look left of the widest point: if the swings there were expanding out of a selloff, it is a diamond; if the range was wide from its first swing, it is a triangle.
How reliable is the diamond bottom pattern?
Diamonds appear in the standard chart-pattern references, and the shape has a defined geometry: two diverging boundaries joined to two converging ones. What keeps it at moderate rather than well documented is the drawing. Choosing which swing points anchor the four lines is a judgment call, two analysts can fit different diamonds to the same bars, and a slightly different upper-right line shifts the breakout by a candle or more. Most textbook examples show diamonds at tops, so look for the bullish version to be drawn with extra care. Its strength is a clear exit: a close below the lower-right line says it failed.
References
- Thomas N. Bulkowski. Encyclopedia of Chart Patterns . Wiley , 2005 . ISBN 978-0471668268.
- Robert D. Edwards, John Magee and W.H.C. Bassetti. Technical Analysis of Stock Trends . Routledge , 2018 . ISBN 978-1138069411.
Frequently asked questions
What does a diamond bottom mean?
Is a diamond bottom bullish or bearish?
How do you trade a diamond bottom?
Does a diamond bottom need confirmation?
How reliable is the diamond bottom?
Practise spotting the diamond bottom
Reading about a pattern is not the same as recognising it under time pressure. Chart Guess drills 53 patterns as a 60-second game — read the chart, call BUY or SELL, get the pattern name instantly.