Broadening Bottom Pattern
A broadening bottom is a bullish reversal pattern that forms after a decline, in which price swings make lower lows and higher highs between a falling lower trendline and a rising upper one, a widening megaphone that is read as bullish once a sell-off stops short of the lower line and price closes above the upper one.
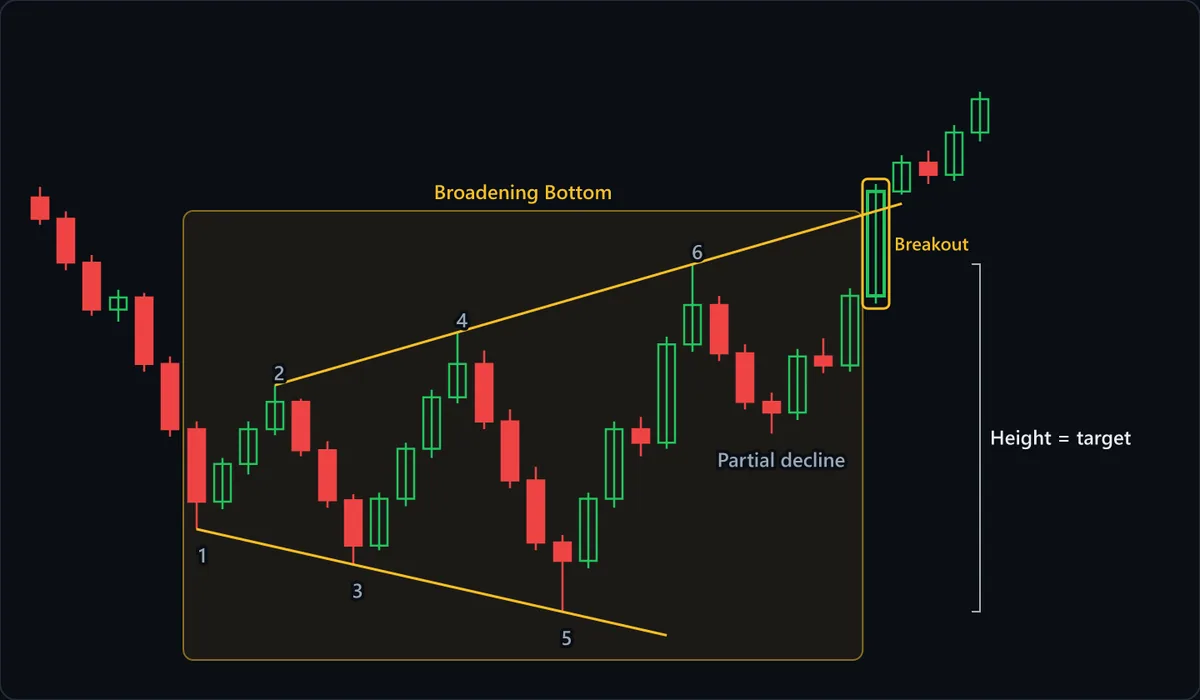
Chart data
| # | Open | High | Low | Close |
|---|---|---|---|---|
| 1 | 122.4 | 123.1 | 120.6 | 121 |
| 2 | 121 | 121.5 | 117.6 | 118.1 |
| 3 | 118.1 | 118.6 | 114.6 | 115 |
| 4 | 115 | 116.3 | 114.2 | 115.8 |
| 5 | 115.8 | 116.1 | 110.9 | 111.4 |
| 6 | 111.4 | 111.9 | 106.6 | 107.1 |
| 7 | 107.1 | 107.6 | 100.49 | 102.3 |
| 8 | 102.3 | 105.2 | 101.8 | 104.8 |
| 9 | 104.8 | 107.6 | 104.1 | 107.1 |
| 10 | 107.1 | 110 | 106.7 | 108.9 |
| 11 | 108.9 | 109.1 | 105.3 | 105.7 |
| 12 | 105.7 | 106.3 | 101.9 | 102.4 |
| 13 | 102.4 | 102.8 | 98.15 | 99.4 |
| 14 | 99.4 | 102.9 | 99.1 | 102.5 |
| 15 | 102.5 | 106.2 | 102 | 105.8 |
| 16 | 105.8 | 109.7 | 105.2 | 109.2 |
| 17 | 109.2 | 113.5 | 108.8 | 111.4 |
| 18 | 111.4 | 112.3 | 107.1 | 107.6 |
| 19 | 107.6 | 108.4 | 103.2 | 103.7 |
| 20 | 103.7 | 104.6 | 99.1 | 99.6 |
| 21 | 99.6 | 100.1 | 95.03 | 98.4 |
| 22 | 98.4 | 102.9 | 97.9 | 102.5 |
| 23 | 102.5 | 107.6 | 101.9 | 107.1 |
| 24 | 107.1 | 107.9 | 105.3 | 106.2 |
| 25 | 106.2 | 113.2 | 105.8 | 112.7 |
| 26 | 112.7 | 118 | 112.2 | 115.3 |
| 27 | 115.3 | 115.9 | 111.6 | 112.1 |
| 28 | 112.1 | 112.7 | 108.4 | 108.9 |
| 29 | 108.9 | 109.5 | 106.8 | 108.2 |
| 30 | 108.2 | 112.4 | 107.7 | 111.9 |
| 31 | 111.9 | 113.1 | 110.8 | 111.3 |
| 32 | 111.3 | 116.4 | 110.9 | 115.9 |
| 33 | 115.9 | 123.3 | 115.4 | 122.8 |
| 34 | 122.8 | 125.2 | 122.6 | 124.7 |
| 35 | 124.7 | 125.5 | 123.3 | 123.9 |
| 36 | 123.9 | 127.2 | 123.5 | 126.7 |
| 37 | 126.7 | 129.4 | 126.1 | 128.9 |
At a glance
| Type | Bullish reversal |
|---|---|
| Direction | Bullish |
| Bars required | Multiple bars |
| Family | Chart pattern |
| Evidence | Moderate |
| Also called | broadening bottom pattern, megaphone bottom, bullish broadening formation |
What timeframe does it work on?
Because it needs at least five alternating swings, each wider than the last, a broadening bottom takes longer to build than a flag or a single reversal candle; on daily charts the classic examples span weeks to months. Intraday versions do appear around news-driven whipsaws, but their widening swings are often just session noise. On any timeframe, the expanding range means the stop distance grows as the pattern matures.
Anatomy of the pattern
- The prior decline — The megaphone has to sit at the end of a downtrend, as it does on the chart before point 1. Without that decline there is nothing to reverse, and the same diverging shape after an advance is read as a topping pattern instead.
- Lows 1, 3 and 5 — Each sell-off undercuts the previous low, and a line through them slopes down. Every new low looks like the downtrend resuming, which is why sellers keep pressing.
- Highs 2, 4 and 6 — Each rebound clears the previous high, and a line through them slopes up. Rallies overshoot just as declines do, so both sides are getting more aggressive rather than one giving in.
- Partial decline — After high 6, the next drop turns well above the lower trendline instead of tagging it. That shortfall is the first swing that breaks the overshoot rhythm, and it is the tell that sellers no longer have the force to make a new low.
- Breakout — The highlighted candle closes above the rising upper trendline. Because that line slopes up, the breakout level is the line's value at that bar, which is higher than any earlier touch.
- Height = target — The bracket measures the megaphone at its widest, from high 6 down to low 5. Projected upward from the breakout, it gives the conventional measured-move objective.
How to identify it
- A decline precedes the structure; the first numbered low is a continuation of that downtrend, not a random dip in a range.
- There are at least five alternating swing points, and each low is lower and each high higher than the one before it.
- Both trendlines can be drawn through actual swing extremes, and they diverge: the upper slopes up, the lower slopes down.
- The swings are roughly balanced, so neither line is flat; a horizontal lower line with only rising highs is a different, right-angled formation.
- Often, a late decline turns before reaching the lower trendline, leaving a higher low inside the megaphone; this partial decline is the strongest hint that the break will be upward.
- The breakout is a close above the upper trendline measured at that bar, ideally on expanding volume.
How to trade it
Entry. There are two common entries. The aggressive one buys a bounce off the lower trendline, trading the megaphone's own swing before any breakout exists. The conservative one waits for a partial decline to turn above the lower line and then buys a close above the upper trendline. The first gets a far better price but bets on another overshoot holding; the second pays more but only acts after sellers have visibly fallen short.
Stop. For a lower-line bounce, below the lower trendline, because a sustained close beneath it means the low did not hold this time. For the breakout entry, below the low of the partial decline: that higher low is the evidence the trade rests on. Either way the stop is wide by nature, which calls for smaller size rather than a tighter, arbitrary stop.
Target. For a swing trade inside the pattern, the upper trendline is the natural exit, since that is where every prior rally has turned. For the breakout, take the widest height of the megaphone and project it upward from the breakout point. That projection is large by design, so check prior swing highs from the earlier decline that sit in the way.
What invalidates it
- A sustained close below the lower trendline. The megaphone has failed as a bottom, and the move is more likely a continuation of the original decline.
- The partial decline keeps going and tags or undercuts the lower line. It was not partial; it is simply swing 7, and the pattern has not yet signaled a turn.
- The upside break closes back inside the megaphone within a bar or two. Broadening patterns are prone to failed breaks, which is why a close and follow-through matter more here than usual.
- There was no prior decline. A widening range after an advance is the topping version, with the opposite bias.
Often confused with
Broadening Bottom vs Broadening Top: what's the difference?
The two share the same diverging lines; what separates them is the trend into the pattern and the exit. A broadening bottom follows a decline and breaks the upper line after a higher low; a broadening top follows an advance and breaks the lower line after a rally stops short of the upper one.
Broadening Bottom vs Diamond Bottom: what's the difference?
A diamond bottom starts as a megaphone but then narrows, with highs and lows converging before the breakout. If the swings stop widening and begin contracting, you are watching a diamond form, not a broadening bottom.
Broadening Bottom vs Symmetrical Triangle: what's the difference?
The lines run in opposite directions. A symmetrical triangle has falling highs and rising lows that converge toward an apex; a broadening bottom has rising highs and falling lows that spread apart.
How reliable is the broadening bottom pattern?
The broadening bottom sits in the moderate tier because it is a recognized classical formation with objective rules, yet the evidence varies with how those rules are set. It is objective enough to be coded: Lo, Mamaysky and Wang included broadening bottoms among the patterns they defined algorithmically. But the classic texts describe broadening formations mainly as topping structures and treat the bottoming version as the rarer variant, and definitions differ on how many touches are required and whether the partial decline is mandatory. The structural weakness is that the range widens with every swing, so risk per trade grows as the pattern matures and false breaks are common.
References
- Thomas N. Bulkowski. Encyclopedia of Chart Patterns . Wiley , 2005 . ISBN 978-0471668268.
- Robert D. Edwards, John Magee and W.H.C. Bassetti. Technical Analysis of Stock Trends . Routledge , 2018 . ISBN 978-1138069411.
- Andrew W. Lo, Harry Mamaysky and Jiang Wang. Foundations of Technical Analysis: Computational Algorithms, Statistical Inference, and Empirical Implementation . The Journal of Finance , 2000 .
Frequently asked questions
What does a broadening bottom mean?
Is a broadening bottom bullish or bearish?
How do you trade a broadening bottom?
Does a broadening bottom need confirmation?
How reliable is the broadening bottom?
Practise spotting the broadening bottom
Reading about a pattern is not the same as recognising it under time pressure. Chart Guess drills 53 patterns as a 60-second game — read the chart, call BUY or SELL, get the pattern name instantly.