Falling Wedge Pattern
A falling wedge is a bullish chart pattern in which price makes lower highs and lower lows between two downward-sloping trendlines that converge, because the highs fall faster than the lows, until price closes above the upper line.
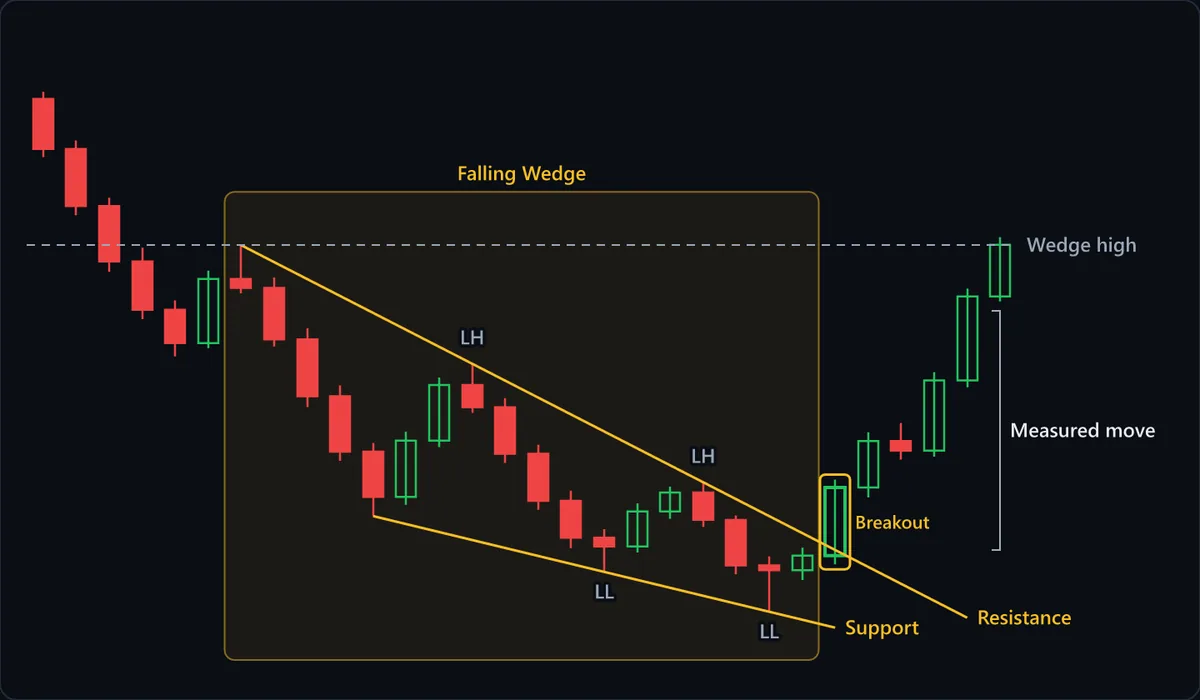
Chart data
| # | Open | High | Low | Close |
|---|---|---|---|---|
| 1 | 129.34 | 129.71 | 126.42 | 126.83 |
| 2 | 126.83 | 127.26 | 123.51 | 123.97 |
| 3 | 123.97 | 124.38 | 120.66 | 121.18 |
| 4 | 121.18 | 121.87 | 118.29 | 118.76 |
| 5 | 118.76 | 119.23 | 116.41 | 117.08 |
| 6 | 117.08 | 120.72 | 116.83 | 120.31 |
| 7 | 120.31 | 122 | 119.58 | 119.86 |
| 8 | 119.86 | 120.38 | 116.92 | 117.27 |
| 9 | 117.27 | 117.83 | 113.87 | 114.42 |
| 10 | 114.42 | 114.96 | 111.18 | 111.63 |
| 11 | 111.63 | 112.07 | 108.4 | 109.37 |
| 12 | 109.37 | 112.64 | 108.97 | 112.19 |
| 13 | 112.19 | 115.36 | 111.86 | 114.98 |
| 14 | 114.98 | 116.05 | 113.58 | 113.86 |
| 15 | 113.86 | 114.32 | 111.07 | 111.53 |
| 16 | 111.53 | 111.98 | 108.72 | 109.17 |
| 17 | 109.17 | 109.68 | 106.79 | 107.32 |
| 18 | 107.32 | 107.74 | 105.6 | 106.88 |
| 19 | 106.88 | 109.04 | 106.57 | 108.63 |
| 20 | 108.63 | 109.88 | 108.27 | 109.58 |
| 21 | 109.58 | 110.1 | 107.86 | 108.21 |
| 22 | 108.21 | 108.43 | 105.47 | 105.92 |
| 23 | 105.92 | 106.37 | 103.6 | 105.68 |
| 24 | 105.68 | 106.81 | 105.19 | 106.42 |
| 25 | 106.42 | 110.23 | 105.98 | 109.84 |
| 26 | 109.84 | 112.61 | 109.33 | 112.17 |
| 27 | 112.17 | 113.08 | 111.24 | 111.69 |
| 28 | 111.69 | 115.63 | 111.38 | 115.21 |
| 29 | 115.21 | 119.82 | 114.87 | 119.43 |
| 30 | 119.43 | 122.41 | 119.18 | 122.02 |
At a glance
| Type | Continuation |
|---|---|
| Direction | With the trend |
| Bars required | Multiple bars |
| Family | Chart pattern |
| Evidence | Moderate |
| Also called | falling wedge pattern, descending wedge, bullish wedge |
What timeframe does it work on?
Falling wedges appear on intraday, daily and weekly charts, but the pattern needs at least two clean touches on each line, and on very short timeframes random swings make it easy to connect points that mean nothing. The higher the timeframe, the more each touch represents a real rejection. Whatever the scale, the wedge should still have room left before its apex when it breaks; one that grinds right into the point has lost its coil.
Anatomy of the pattern
- Resistance (lower highs) — The upper line, drawn through the wedge high and each lower high (LH). It falls steeply because every bounce is sold earlier than the one before. This is the line the trade is built around: a close above it is the trigger.
- Support (lower lows) — The lower line through the lower lows (LL). It also slopes down, but more gently. Sellers are still making new lows, yet each push gains less ground, which is the first sign that supply is running out.
- Convergence — Because resistance falls faster than support, the two lines close in on each other. The narrowing range, ideally with shrinking volume, shows a decline losing energy rather than a trend gathering it.
- The breakout — A candle that closes above the resistance line, typically before price reaches the apex. A break here forces late shorts who sold the lower lows to cover, and that buying can feed the first leg up.
- Wedge high and measured move — The wedge high, where the pattern started, is the classic first target. The measured move, the wedge's widest height projected up from the breakout, gives a minimum reference if the old high is far away.
How to identify it
- Both trendlines slope downward, and each has at least two touches: lower highs on top, lower lows underneath.
- The upper line falls more steeply than the lower one, so the lines converge toward an apex instead of running parallel.
- Each new low undercuts the previous one by less, and the down-legs get shorter as the wedge develops.
- Volume and candle ranges tend to shrink as price moves deeper into the wedge.
- The breakout is a close above the upper trendline, well before the lines meet at the apex, not a wick that closes back inside.
- There is something to reverse: a prior decline into the wedge, or a pullback inside a larger uptrend.
How to trade it
Entry. Buy on a close above the upper (resistance) trendline, or on a pullback that retests the broken line from above and holds it. The close matters because a falling resistance line gets poked often; one candle closing outside is the evidence that sellers have lost control of the bounce. The retest entry gives a better price but can be missed when short covering drives price straight up.
Stop. Below the last swing low inside the wedge, the final lower low before the breakout. That low is the sellers' last attempt to extend the decline, so a move back beneath it means the breakout failed and the downtrend has resumed.
Target. The start of the wedge, its highest point, where the selling began. At minimum, project the wedge's widest height upward from the breakout. Check overhead levels first: earlier lower highs inside the wedge, or a congestion zone above it, can stall the rally before either target is reached.
What invalidates it
- A close below the lower trendline on expanding volume. That turns the slowing decline into a fresh leg down, and the bullish reading no longer holds.
- The lines run parallel instead of converging. Without the narrowing, the lows are not losing momentum; that is a descending channel, which carries no upward bias.
- Price drifts into the apex without breaking out. A wedge that coils to the point has no remaining tension, and the bullish lean no longer applies to whatever move follows.
- The breakout closes back inside the wedge within a bar or two. A failed break shows buyers could not hold the line, and trapped buyers often accelerate the next drop.
- The lows are falling as fast as the highs, or faster. If the support line is the steeper one, the selling is accelerating rather than fading.
Often confused with
Falling Wedge vs Bullish Wolfe Wave: what's the difference?
A falling wedge is normally bought on a close above its upper line, and its final low can stay inside the wedge. A bullish Wolfe wave needs wave 5 to pierce the lower 1-3 line and recover, and it targets the rising 1-4 line rather than the wedge's starting level.
Falling Wedge vs Descending Channel: what's the difference?
A descending channel's lines are parallel, so every down-leg is about as long as the last. In a falling wedge the lines converge and each new low is shallower. Measure the range: if it is not narrowing, it is a channel.
Falling Wedge vs Descending Triangle: what's the difference?
A descending triangle has a flat support line, buyers defending the same price, and is usually read as bearish. A falling wedge's lower line slopes down too. Flat lows make it a triangle; sloping lows make it a wedge.
Falling Wedge vs Rising Wedge: what's the difference?
The mirror image. A rising wedge slopes upward, with higher lows climbing faster than the higher highs, and usually breaks down. If both lines point down and the upper line is steeper, it is a falling wedge.
How reliable is the falling wedge pattern?
The falling wedge is described in the standard chart-pattern references cited below, which treat its bias as bullish, whether it forms as a bottom after a decline or as a pullback inside an uptrend. The tier is moderate rather than well documented for the same reason as its mirror, the rising wedge. Both lines are sloped and drawn through touch points the trader chooses, so connecting a different pair of highs moves the breakout level and can change whether a breakout has happened at all. Sources also differ on how many touches qualify and on how close to the apex a break may come. Some falling wedges break down through support instead, so the bias is a lean, not a rule. Because the breakout level moves with whichever touches you connect, no success rate is quoted here.
References
- Thomas N. Bulkowski. Encyclopedia of Chart Patterns . Wiley , 2005 . ISBN 978-0471668268.
- Robert D. Edwards, John Magee and W.H.C. Bassetti. Technical Analysis of Stock Trends . Routledge , 2018 . ISBN 978-1138069411.
- John J. Murphy. Technical Analysis of the Financial Markets . New York Institute of Finance , 1999 . ISBN 978-0735200661.
Frequently asked questions
What does a falling wedge mean?
Is a falling wedge bullish or bearish?
How do you trade a falling wedge?
Does a falling wedge need confirmation?
Can a falling wedge break down?
Practise spotting the falling wedge
Reading about a pattern is not the same as recognising it under time pressure. Chart Guess drills 53 patterns as a 60-second game — read the chart, call BUY or SELL, get the pattern name instantly.