Descending Triangle Pattern
A descending triangle is a bearish chart pattern in which price keeps bouncing off a flat support level while each rally peaks lower, squeezing the range against that floor until a close below support shows the buyers defending it have given way.
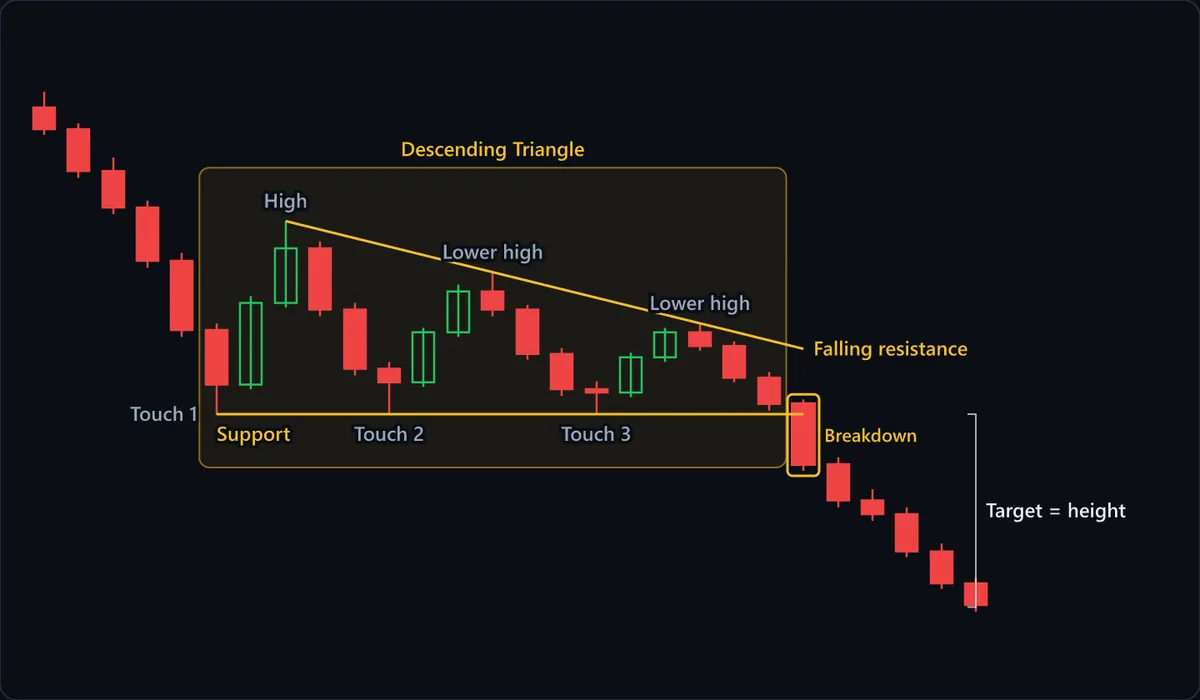
Chart data
| # | Open | High | Low | Close |
|---|---|---|---|---|
| 1 | 127 | 128.4 | 124.6 | 125.1 |
| 2 | 125.1 | 125.6 | 120.8 | 121.4 |
| 3 | 121.4 | 122.6 | 117.6 | 118.2 |
| 4 | 118.2 | 118.8 | 112.9 | 113.5 |
| 5 | 113.5 | 114.2 | 106.8 | 107.4 |
| 6 | 107.4 | 108 | 100 | 102.6 |
| 7 | 102.6 | 110.4 | 102.2 | 109.8 |
| 8 | 109.8 | 117 | 109.4 | 114.6 |
| 9 | 114.6 | 115.2 | 108.6 | 109.2 |
| 10 | 109.2 | 109.8 | 103.4 | 104 |
| 11 | 104 | 104.6 | 100 | 102.8 |
| 12 | 102.8 | 107.6 | 102.4 | 107.2 |
| 13 | 107.2 | 111.4 | 106.8 | 110.8 |
| 14 | 110.8 | 112.5 | 108.6 | 109.2 |
| 15 | 109.2 | 109.6 | 104.8 | 105.3 |
| 16 | 105.3 | 105.8 | 101.6 | 102.2 |
| 17 | 102.2 | 102.9 | 100 | 101.9 |
| 18 | 101.9 | 105.4 | 101.5 | 105 |
| 19 | 105 | 107.6 | 104.6 | 107.2 |
| 20 | 107.2 | 108 | 105.6 | 106 |
| 21 | 106 | 106.4 | 102.8 | 103.2 |
| 22 | 103.2 | 103.7 | 100.3 | 100.9 |
| 23 | 100.9 | 101.3 | 95 | 95.6 |
| 24 | 95.6 | 96.2 | 91.8 | 92.4 |
| 25 | 92.4 | 93.4 | 90.6 | 91.2 |
| 26 | 91.2 | 91.8 | 87.4 | 87.9 |
| 27 | 87.9 | 88.6 | 84.6 | 85.1 |
| 28 | 85.1 | 85.6 | 82.6 | 83.2 |
At a glance
| Type | Continuation |
|---|---|
| Direction | With the trend |
| Bars required | Multiple bars |
| Family | Chart pattern |
| Evidence | Well documented |
| Also called | descending triangle pattern, bearish triangle, descending triangle breakdown |
What timeframe does it work on?
The geometry is identical on a 5-minute chart and a weekly one, but the touches carry different weight. Intraday, a flat support line is often a round number tested three times in an hour; on a daily chart each touch is a separate session of buyers defending the level, so the eventual break says more. On any timeframe, it should resolve before the apex.
Anatomy of the pattern
- Prior decline — In its usual continuation form the triangle interrupts a downtrend, as the falling candles on the left of the chart show. After an advance, the same structure is read as a potential top.
- Support (Touch 1, 2, 3) — A horizontal floor where buyers step in at the same price each time. Buyers refusing to bid any higher than that floor is half of the pattern's bearish case.
- High and lower highs — Each bounce off support stalls below the previous peak. Sellers are willing to hit bids at progressively lower prices, and joining those peaks gives the falling resistance line.
- Narrowing range — With a flat bottom and a sloping top, every swing is smaller than the last, concentrating orders around the one support level everyone has watched hold.
- Breakdown — The marked candle opens near support and closes well below it. The close beneath the floor, not an intraday dip, turns the shape into a signal.
- Target = height — The bracket on the right takes the widest part of the triangle, from the first high to support, and projects that distance below the breakdown level.
How to identify it
- A horizontal support line has at least two distinct touches with real bounces between them, rather than price lying along the line.
- Each rally peaks below the one before, and the peaks can be joined by a single descending trendline.
- Later swings are visibly smaller than earlier ones as the falling line closes in on the flat one.
- Where volume is available, it tapers as price works toward the apex.
- A candle closes below support, ideally well before the two lines meet; a break right at the apex carries little of the built-up pressure.
- A preceding decline makes it a continuation setup; a preceding advance makes it a possible top.
How to trade it
Entry. Sell on a close below the horizontal support, or on a failed rally back to that broken level. The close confirms that a floor defended several times has stopped holding; the retest entry trades some price for evidence that old support now acts as resistance. Shorting before the break bets on an outcome the pattern has not delivered.
Stop. Above the most recent lower high, which is 108 on this chart. That peak is the last place sellers proved they could cap a rally, so a move back over it breaks the sequence of lower highs the pattern rests on. The stop is often wide as a result, and the answer is a smaller position rather than an arbitrary tighter stop.
Target. Measure the triangle at its widest, from the first high down to support, and subtract that height from the breakdown point. Here that is 117 minus 100, a 17-point projection toward 83. Treat it as a reference, not a forecast: an earlier swing low sitting between entry and target will often halt the drop first.
What invalidates it
- A close above the descending trendline. If buyers can push through the line of lower highs, the steady selling pressure the pattern depends on is gone.
- Price closes below support, then closes back above it within a bar or two. A failed breakdown traps late shorts, whose covering can drive a sharp rally.
- The highs are not really falling. Rallies that top out at about the same price make a horizontal channel between two flat lines, which has no directional bias built in.
- Support is a wide zone rather than a level. With touches scattered across a band, there is no clean line for a close to break.
- Price drifts into the apex without breaking. By then the range is too narrow for a break either way to mean much.
Often confused with
Descending Triangle vs Falling Wedge: what's the difference?
Both have a falling upper line, but a falling wedge's lower line slopes down too, so it makes lower lows as it narrows and conventionally breaks upward. If each test of the lower line lands below the last, it is a wedge, not a descending triangle.
Descending Triangle vs Horizontal Channel: what's the difference?
A descending triangle keeps the flat floor but each rally peaks lower than the last. If resistance holds at one price on every test, as touches 1, 3 and 5 do here, it is a channel, not a triangle.
Descending Triangle vs Symmetrical Triangle: what's the difference?
A symmetrical triangle pairs lower highs with higher lows, so both lines converge and the shape implies no direction. A descending triangle's lower line is flat: buyers refuse to bid any higher, and that refusal is where its bearish tilt comes from.
Descending Triangle vs Triple Bottom: what's the difference?
Both show three tests of the same low. In a triple bottom the rallies between tests reach roughly the same height and the pattern resolves upward through them; when each rally off the floor is weaker than the last, the floor is being worn down, not confirmed.
How reliable is the descending triangle pattern?
The descending triangle is one of the classic triangles covered in both standard chart-pattern references, and it sits in the well-documented tier for the same reason flags do: its rules are objective. A horizontal support line, a run of lower highs, a measurable height and a single trigger level can be defined precisely and tested consistently. What the evidence does not support is treating the bearish tilt as a certainty. Descending triangles do break upward, which is why the trade is taken on a close below support rather than on the shape alone. Published results also shift with the number of touches required and with whether a breakdown that later reverses is scored as a success.
References
- Thomas N. Bulkowski. Encyclopedia of Chart Patterns . Wiley , 2005 . ISBN 978-0471668268.
- Robert D. Edwards, John Magee and W.H.C. Bassetti. Technical Analysis of Stock Trends . Routledge , 2018 . ISBN 978-1138069411.
Frequently asked questions
Is a descending triangle bullish or bearish?
How do you trade a descending triangle?
What happens after a descending triangle breaks down?
What is the difference between a descending and an ascending triangle?
How many touches does a descending triangle need?
Practise spotting the descending triangle
Reading about a pattern is not the same as recognising it under time pressure. Chart Guess drills 53 patterns as a 60-second game — read the chart, call BUY or SELL, get the pattern name instantly.