Cup and Handle Pattern
A cup and handle is a bullish continuation pattern: a broad, U-shaped decline and recovery (the cup) back to roughly its starting price, followed by a shallow pullback just under that level (the handle), before price breaks out above the rim.
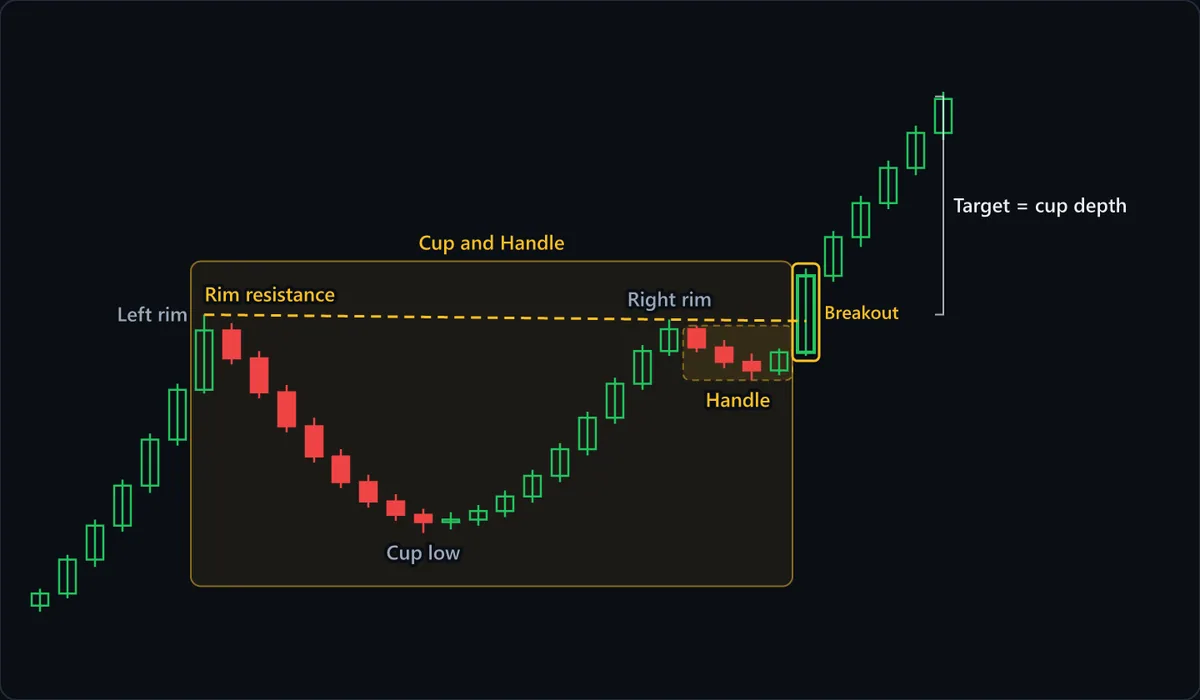
Chart data
| # | Open | High | Low | Close |
|---|---|---|---|---|
| 1 | 86 | 87.4 | 85.5 | 87 |
| 2 | 87 | 90.2 | 86.6 | 89.8 |
| 3 | 89.8 | 93.1 | 89.2 | 92.6 |
| 4 | 92.6 | 96.4 | 92.1 | 95.9 |
| 5 | 95.9 | 100.2 | 95.3 | 99.7 |
| 6 | 99.7 | 104.3 | 99.2 | 103.8 |
| 7 | 103.8 | 110 | 103.5 | 108.7 |
| 8 | 108.7 | 109.3 | 105.9 | 106.4 |
| 9 | 106.4 | 107 | 103.1 | 103.6 |
| 10 | 103.6 | 104.2 | 100.3 | 100.8 |
| 11 | 100.8 | 101.5 | 97.8 | 98.3 |
| 12 | 98.3 | 98.9 | 95.7 | 96.2 |
| 13 | 96.2 | 96.8 | 94.1 | 94.6 |
| 14 | 94.6 | 95.2 | 93 | 93.5 |
| 15 | 93.5 | 94 | 92 | 92.9 |
| 16 | 92.9 | 93.7 | 92.3 | 93.1 |
| 17 | 93.1 | 94.3 | 92.6 | 93.8 |
| 18 | 93.8 | 95.5 | 93.3 | 95 |
| 19 | 95 | 97.2 | 94.5 | 96.7 |
| 20 | 96.7 | 99.4 | 96.2 | 98.9 |
| 21 | 98.9 | 102 | 98.4 | 101.5 |
| 22 | 101.5 | 104.8 | 101 | 104.3 |
| 23 | 104.3 | 107.5 | 103.8 | 107 |
| 24 | 107 | 109.6 | 106.6 | 108.8 |
| 25 | 108.8 | 109.1 | 106.9 | 107.3 |
| 26 | 107.3 | 107.9 | 105.6 | 106.1 |
| 27 | 106.1 | 106.8 | 104.6 | 105.4 |
| 28 | 105.4 | 107.2 | 105 | 106.9 |
| 29 | 106.9 | 113.8 | 106.6 | 113.2 |
| 30 | 113.2 | 116.9 | 112.7 | 116.4 |
| 31 | 116.4 | 119.8 | 115.6 | 119.2 |
| 32 | 119.2 | 122.7 | 118.7 | 122.1 |
| 33 | 122.1 | 125.6 | 121.5 | 125 |
| 34 | 125 | 128.4 | 124.4 | 127.8 |
At a glance
| Type | Continuation |
|---|---|
| Direction | With the trend |
| Bars required | Multiple bars |
| Family | Chart pattern |
| Evidence | Moderate |
| Also called | cup with handle, cup-and-handle pattern |
What timeframe does it work on?
The cup needs real time to form a genuine rounded shape rather than a V-shaped spike and recovery. On daily charts the cup usually takes weeks, not days, to round out; on weekly charts it can span months. A cup that forms in only a handful of bars is usually just a sharp dip, not this pattern. The handle is deliberately shorter and shallower than the cup; if the pullback sinks into the lower half of the cup or lasts nearly as long as the cup itself, it has stopped being a handle.
Anatomy of the pattern
- The cup — A broad, rounded decline and recovery back toward the level where it started. A smooth U-shape is the point — a sharp V-shaped spike down and back up is a different structure, not a cup.
- The rim — The price level at the top of both sides of the cup, which acts as resistance until the pattern breaks out above it.
- The handle — A short, shallow pullback that forms after price returns to the rim, typically retracing only a modest portion of the cup's right side. It is usually read as a final shakeout of impatient holders and of supply from buyers who bought near the old high, rather than a change in trend.
- The breakout — Price closes above the rim, ideally on rising volume. This is what completes the pattern — a cup with no breakout is just a rounded consolidation.
- The measured move — The conventional target projects the cup's depth (rim to the bottom of the cup) upward from the breakout point.
How to identify it
- The decline and recovery form a visibly rounded U-shape rather than a sharp V-shaped spike.
- Both sides of the cup return to approximately the same price level, forming the rim.
- After reaching the rim, price drifts down or sideways in a short handle that stays in the upper half of the cup.
- The handle is noticeably shorter in duration and shallower in depth than the cup itself.
- Volume dries up during the handle and expands on the breakout.
- Price closes above the rim to complete the breakout.
How to trade it
Entry. The standard entry is a close above the handle's high, which sits at or just under the rim and completes the pattern; a close above the rim itself is the more conservative version. Aggressive traders sometimes enter earlier, on a break of the handle's down-sloping trendline, accepting a higher chance of failure for tighter risk.
Stop. Below the low of the handle. The handle is supposed to be a shallow pause; a close beneath its low means the pullback has gone deeper than the pattern's premise allows.
Target. The measured move: add the cup's depth (the vertical distance from the rim down to the bottom of the cup) to the breakout price. As with any projection, check the chart for prior resistance levels that sit between the entry and the target.
What invalidates it
- The decline and recovery form a sharp V rather than a rounded U. A V-shaped spike-and-recover is a different structure, however similar the endpoints look.
- The handle drops into the lower half of the cup (retracing more than about half of the cup's depth), or drags on until it rivals the cup in duration. At that point it is no longer a brief pause but a fresh decline.
- Price closes below the handle's low before breaking out. The shakeout has turned into a real decline.
- Price never closes above the rim. A rounded recovery that stalls under resistance, handle or not, is an unconfirmed pattern, not a cup and handle.
- There was no prior uptrend leading into the cup. The pattern is defined as a continuation setup within an existing advance; without a prior uptrend there is nothing for it to continue.
Often confused with
Cup and Handle vs Double Bottom: what's the difference?
A cup and handle is one smooth, rounded trough with a single low, usually after a prior advance. A double bottom has two distinct lows (sharp or rounded) separated by a clear rally peak, usually after a decline. If you can count two separate lows rather than one curve, it is a double bottom.
Cup and Handle vs Inverse Cup and Handle: what's the difference?
The cup and handle is the same shape flipped: a rounded bowl under a resistance rim, with a small dip as the handle and a breakout above it. If the curve sags downward and the trigger is a break higher, it is the bullish cup, not the inverse.
How reliable is the cup and handle pattern?
The cup and handle comes from growth-stock investing rather than the oldest technical-analysis texts, and it has had less independent academic testing than head and shoulders or double tops and bottoms. How well it holds up depends heavily on how strictly the rounded cup and the shallow handle are defined; a sharp V-shaped dip is often mislabelled as a cup. Treat it as a probability, not a guarantee.
References
- Thomas N. Bulkowski. Encyclopedia of Chart Patterns . Wiley , 2005 . ISBN 978-0471668268.
Frequently asked questions
How long should a cup and handle take to form?
Why does the handle matter if the cup already recovered to the rim?
What if the recovery is a sharp V instead of a rounded U?
How do you set a target for a cup and handle breakout?
Practise spotting the cup and handle
Reading about a pattern is not the same as recognising it under time pressure. Chart Guess drills 53 patterns as a 60-second game — read the chart, call BUY or SELL, get the pattern name instantly.