Inverse Cup and Handle Pattern
An inverse cup and handle is a bearish chart pattern in which price arches up and rolls back down in a rounded dome to a common support level, makes a small, weak bounce (the handle), and then breaks below the handle's low to start, or resume, a decline.
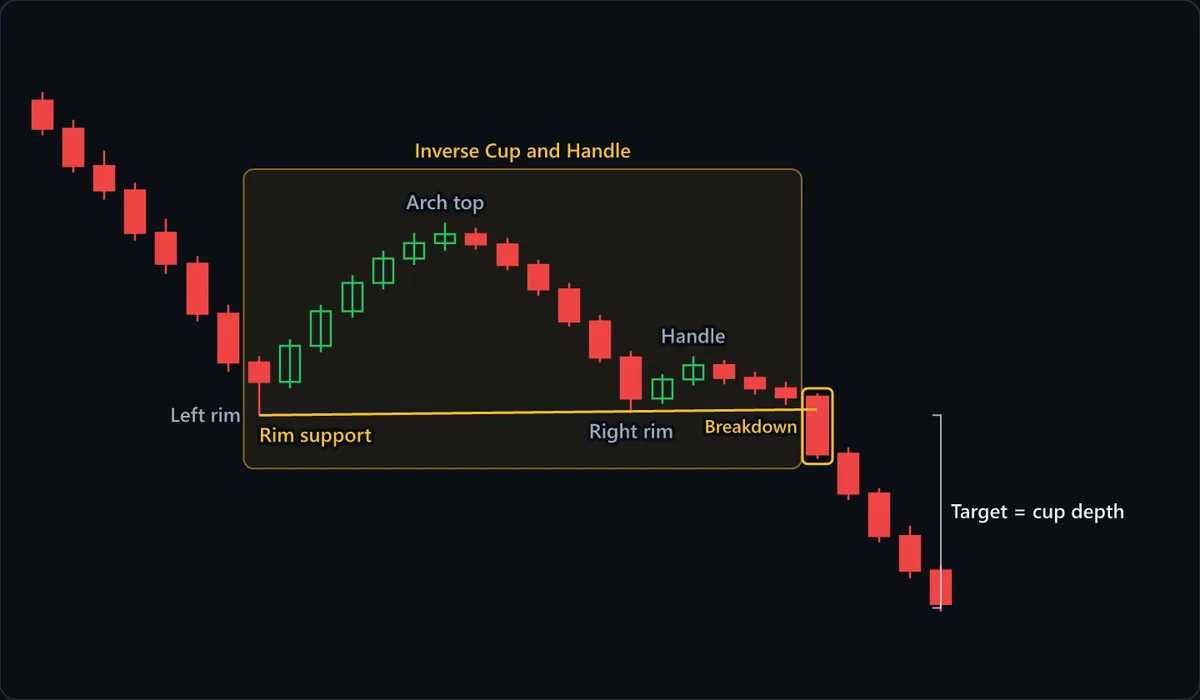
Chart data
| # | Open | High | Low | Close |
|---|---|---|---|---|
| 1 | 124.5 | 125.2 | 121.8 | 122.3 |
| 2 | 122.3 | 123 | 118.9 | 119.4 |
| 3 | 119.4 | 120.6 | 116.8 | 117.5 |
| 4 | 117.5 | 118.1 | 113.6 | 114.2 |
| 5 | 114.2 | 115.3 | 111 | 111.8 |
| 6 | 111.8 | 112.4 | 107.3 | 107.9 |
| 7 | 107.9 | 108.6 | 103.4 | 104.1 |
| 8 | 104.1 | 104.6 | 100 | 102.6 |
| 9 | 102.6 | 105.9 | 102.1 | 105.4 |
| 10 | 105.4 | 108.6 | 104.9 | 108.1 |
| 11 | 108.1 | 110.9 | 107.6 | 110.3 |
| 12 | 110.3 | 112.8 | 109.8 | 112.2 |
| 13 | 112.2 | 114.2 | 111.7 | 113.4 |
| 14 | 113.4 | 115 | 112.8 | 114.1 |
| 15 | 114.1 | 114.6 | 112.9 | 113.3 |
| 16 | 113.3 | 113.8 | 111.3 | 111.7 |
| 17 | 111.7 | 112.1 | 109.3 | 109.8 |
| 18 | 109.8 | 110.3 | 106.9 | 107.3 |
| 19 | 107.3 | 107.8 | 104.1 | 104.5 |
| 20 | 104.5 | 105 | 100.3 | 101.3 |
| 21 | 101.3 | 103.2 | 100.9 | 102.8 |
| 22 | 102.8 | 104.6 | 102.3 | 103.9 |
| 23 | 103.9 | 104.3 | 102.4 | 102.9 |
| 24 | 102.9 | 103.4 | 101.6 | 102.1 |
| 25 | 102.1 | 102.6 | 100.8 | 101.4 |
| 26 | 101.4 | 101.7 | 96.6 | 97 |
| 27 | 97 | 97.5 | 93.4 | 93.9 |
| 28 | 93.9 | 94.3 | 90.1 | 90.6 |
| 29 | 90.6 | 91.4 | 87.3 | 87.9 |
| 30 | 87.9 | 88.3 | 84.7 | 85.3 |
At a glance
| Type | Continuation |
|---|---|
| Direction | With the trend |
| Bars required | Multiple bars |
| Family | Chart pattern |
| Evidence | Moderate |
| Also called | inverted cup and handle, inverted cup with handle, bearish cup and handle, upside-down cup and handle |
What timeframe does it work on?
The pattern needs room to be round, so it reads best on daily and weekly charts, where the dome reflects weeks of gradual distribution. On intraday charts a twenty-bar arch is often just a swing high with a pause after it. The handle should be short relative to the dome; one that lasts as long as the dome has become a separate range.
Anatomy of the pattern
- Left rim — The low the dome starts from. In the chart it is where the prior decline stalls near 100. It marks the support that every later part of the pattern is measured against.
- Arch top — The rounded peak. Candles shrink as the rally tops out, then turn red one at a time rather than collapsing at once. That gradual rollover is distribution: sellers feeding supply into strength without forcing price down.
- Right rim — The descent from the arch returns to roughly the same level as the left rim. The two rims together define rim support, the line the trade is built around. Rims at very different levels make the shape a slanted swing, not a cup.
- Handle — A brief, weak bounce off the right rim that stays in the lower part of the dome. In the chart it peaks near 104.60, about a third of the way up the arch, then drifts back to support on small candles. It traps the last dip-buyers.
- Breakdown and target — A close below the handle's low and through rim support completes the pattern. The bracket shows the conventional target: the dome's height, from arch top to rim, measured downward from the breakdown level.
How to identify it
- The top of the structure is a gentle, rounded arch you could trace with a curve, not a single spike or two separate peaks.
- The left and right rims sit at about the same price, so a nearly horizontal support line can be drawn under both.
- The handle bounce retraces less than half of the dome's height; ideally it stalls in the lower third.
- The handle is short and its candles are small compared with the bars that formed the dome.
- The trigger is a candle closing below the handle's low, not a wick that dips through and recovers.
- Volume, where available, expands on the breakdown candle rather than fading.
How to trade it
Entry. Sell on a close below the handle's low. Shorting the arch top is the common mistake: at that point there is only a rounded swing high, and many domes simply become ranges. The handle's failure is what proves the dip-buyers' last attempt was absorbed, so waiting for that close costs some price but skips the domes that never break.
Stop. Above the handle's high. The handle is the final test of buyers' strength; if price recovers past its peak, the bounce was stronger than the pattern allows and the bearish read is wrong. A stop above the arch top is safer in theory but usually makes the risk larger than the projected move justifies.
Target. Take the dome's depth, from the arch top down to rim support, and subtract it from the breakdown level. In the example, a 15-point dome projects from 100 toward 85. Treat it as a reference: a prior swing low between entry and target can halt the move first.
What invalidates it
- The handle rallies above the midpoint of the arch. A bounce that strong says buyers are reclaiming the dome, not making a last weak attempt.
- Price closes above the handle's high after the breakdown or before it. The trapped-buyer logic has failed, and the stop belongs there for that reason.
- The top is sharp and V-shaped rather than rounded. A fast spike and reversal is a different, less dependable structure with no gradual distribution behind it.
- The rims are badly mismatched, so no level actually held on both sides. Without common support there is no floor for the breakdown to break.
- Price closes back above rim support within a bar or two of the breakdown. That is a failed breakdown, and short covering can then fuel a sharp rally.
Often confused with
Inverse Cup and Handle vs Bear Flag: what's the difference?
The handle can resemble a small bear flag, so look at what came before it. A bear flag hangs off a steep, nearly straight drop; the handle follows a slow, curved rollover from a dome.
Inverse Cup and Handle vs Cup and Handle: what's the difference?
The cup and handle is the same shape flipped: a rounded bowl under a resistance rim, with a small dip as the handle and a breakout above it. If the curve sags downward and the trigger is a break higher, it is the bullish cup, not the inverse.
Inverse Cup and Handle vs Double Top: what's the difference?
A double top makes two separate peaks at a similar height with a dip between them. The inverse cup makes one continuous rounded peak, and its trigger comes after the handle, not at the dip between two highs.
Inverse Cup and Handle vs Head and Shoulders: what's the difference?
A head and shoulders has three peaks, the middle one highest. The handle can look like a right shoulder, so check the left side: a head and shoulders also has a comparable peak before the head, which is a distinct pointed high. With no left shoulder and one smooth arch, it is the inverse cup.
How reliable is the inverse cup and handle pattern?
The evidence is moderate, the same tier as its bullish mirror and for the same reason: the definition is elastic. How round the dome must be, how far the handle may bounce and how long each part may last all vary by author, so reported results shift with the rules chosen. The inverted version also gets far less attention in the standard references than the bullish cup and handle. And it is easy to see in hindsight but hard to see while forming: until the handle fails, the dome is just a rounded swing high. Its practical strength is a tight failure point, since the handle's high sits well below the arch top.
References
- Thomas N. Bulkowski. Encyclopedia of Chart Patterns . Wiley , 2005 . ISBN 978-0471668268.
Frequently asked questions
What does an inverse cup and handle mean?
Is an inverse cup and handle bullish or bearish?
How do you trade an inverse cup and handle?
What happens after an inverse cup and handle breaks down?
How reliable is the inverse cup and handle?
Practise spotting the inverse cup and handle
Reading about a pattern is not the same as recognising it under time pressure. Chart Guess drills 53 patterns as a 60-second game — read the chart, call BUY or SELL, get the pattern name instantly.