Head and Shoulders Pattern
A head and shoulders is a bearish reversal pattern made of three peaks: a left shoulder, a higher head, and a right shoulder roughly level with the left. It completes when price closes below the neckline drawn through the two lows between the peaks.
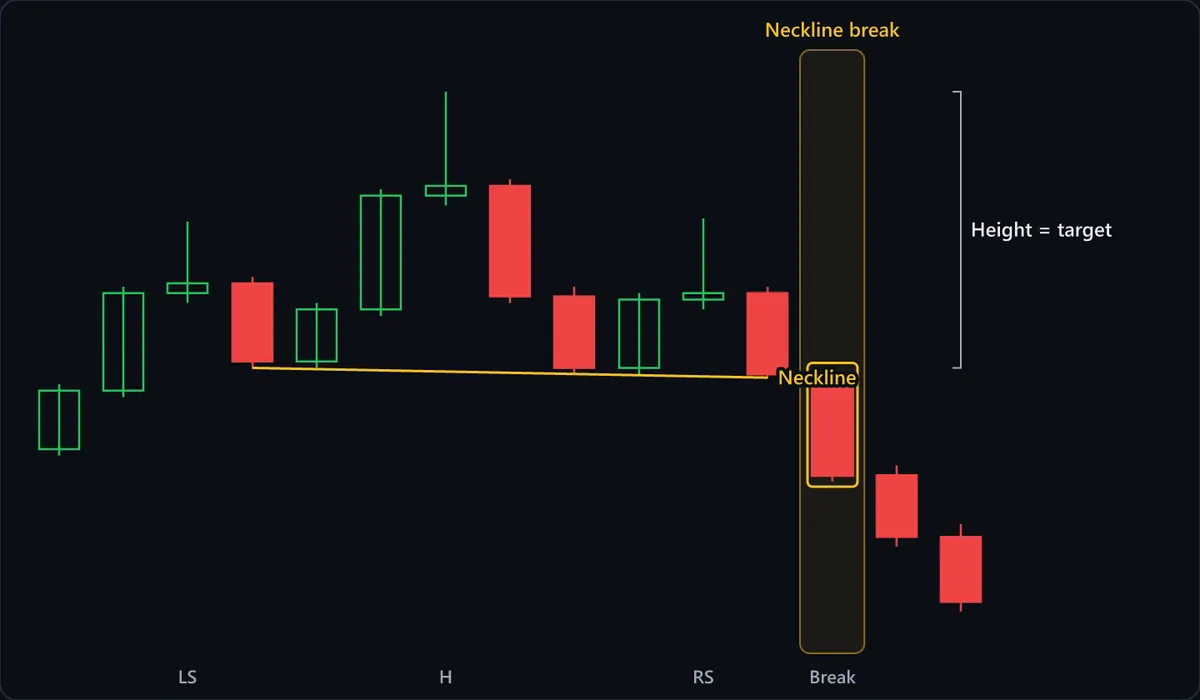
Chart data
| # | Open | High | Low | Close |
|---|---|---|---|---|
| 1 | 90 | 94 | 89.6 | 93.6 |
| 2 | 93.6 | 100 | 93.2 | 99.6 |
| 3 | 99.6 | 104 | 99 | 100.2 |
| 4 | 100.2 | 100.6 | 95 | 95.4 |
| 5 | 95.4 | 99 | 95 | 98.6 |
| 6 | 98.6 | 106 | 98.2 | 105.6 |
| 7 | 105.6 | 112 | 105 | 106.2 |
| 8 | 106.2 | 106.6 | 99 | 99.4 |
| 9 | 99.4 | 100 | 94.6 | 95 |
| 10 | 95 | 99.6 | 94.6 | 99.2 |
| 11 | 99.2 | 104.2 | 98.6 | 99.6 |
| 12 | 99.6 | 100 | 94.4 | 94.6 |
| 13 | 94.6 | 95 | 88 | 88.4 |
| 14 | 88.4 | 89 | 84 | 84.6 |
| 15 | 84.6 | 85.4 | 80 | 80.6 |
At a glance
| Type | Bearish reversal |
|---|---|
| Direction | Bearish |
| Bars required | Multiple bars |
| Family | Chart pattern |
| Evidence | Well documented |
| Also called | head and shoulders top, H&S pattern, head & shoulders |
What timeframe does it work on?
This is a structural pattern that needs room to form, so it is most reliable on daily and weekly charts where the three peaks represent weeks or months of failed attempts to make new highs. Intraday versions exist but are far noisier, because a single session can produce three peaks that carry no information about the broader balance of supply and demand. Larger patterns generally imply larger subsequent moves.
Anatomy of the pattern
- Left shoulder (LS) — A peak formed during the existing uptrend, followed by a pullback. On its own it is unremarkable — every uptrend makes peaks and pullbacks.
- Head (H) — A higher peak than the left shoulder, followed by a decline back toward the previous low. This is still consistent with a healthy uptrend at this stage.
- Right shoulder (RS) — A third peak that fails to reach the head's high, roughly level with the left shoulder. This is the informative part: buyers tried again and could not make a new high, which is the first structural evidence the trend is failing.
- The neckline — A line drawn through the two lows between the peaks. It may slope up or down slightly. This is the level that completes the pattern — until price closes below it, there is no head and shoulders, only three peaks.
- The measured move — The conventional target measures the vertical distance from the head down to the neckline, then projects that same distance below the breakdown point.
How to identify it
- There is a pre-existing uptrend — the pattern must have something to reverse.
- Three distinct peaks are visible, with the middle one clearly the highest.
- The left and right shoulders are roughly comparable in height; neither needs to be exact.
- The two lows between the peaks can be joined by a plausible straight line — the neckline.
- Volume typically declines across the three peaks, and is often lowest on the right shoulder.
- Price closes below the neckline. Until this happens the pattern is potential, not confirmed.
How to trade it
Entry. The standard entry is a close below the neckline, which is what completes the pattern. A common variation waits for the retest — price frequently returns to the neckline from beneath after breaking it, offering a second entry at a better price with a tighter stop, at the cost of missing the moves that never look back.
Stop. Above the right shoulder for a position taken on the neckline break, or above the retest high for a retest entry. The right shoulder is the last point at which buyers demonstrably failed, so a move above it removes the pattern's premise. Stops placed just above the neckline are too tight and get taken out by the retest itself.
Target. Measure from the head down to the neckline and project that distance below the breakdown. Sizeable patterns can imply targets far away, so check the intervening structure — prior support levels and prominent lows will often interrupt the move well before the projection is reached.
What invalidates it
- The neckline has not broken. This is by far the most common error: identifying a head and shoulders while price is still above the neckline and trading it pre-emptively. Until the close beneath it, there is no completed pattern.
- The right shoulder exceeds the head. Then buyers did make a new high, the structural argument disappears, and the trend is intact.
- There was no prior uptrend. A three-peak shape inside a long-running range is not a reversal of anything.
- Price closes back above the neckline after breaking it. Failed breakdowns from this pattern often resolve sharply upward, because the traders positioned short are all wrong at the same level.
- The pattern is drawn on noisy intraday data where three peaks form routinely. The shape needs enough time to represent genuine repeated failure.
Often confused with
Head and Shoulders vs Broadening Top: what's the difference?
In a head and shoulders the highest peak is in the middle, flanked by two lower shoulders of similar height. In a broadening top each peak is higher than the last, so the latest is the highest, and the lower line falls through ever-lower troughs, so the breakdown level keeps falling with time.
Head and Shoulders vs Bull Flag: what's the difference?
A bull flag tightens and stays shallow before continuing upward; a head and shoulders forms three distinct peaks and resolves downward. If the pause is deepening and making identifiable peaks rather than contracting, it is not a flag.
Head and Shoulders vs Diamond Top: what's the difference?
Both have a highest peak flanked by lower ones, but a head and shoulders breaks a roughly horizontal or gently sloped neckline under both shoulders. A diamond's lows also diverge then converge, so its break comes through a rising lower-right line rather than a flat neckline.
Head and Shoulders vs Double Top: what's the difference?
A head and shoulders has three peaks with the middle one clearly higher. A double top has exactly two peaks at comparable heights. If a third peak appears and the middle one stands clearly above the other two, it is a head and shoulders. A third peak at the same height is a triple top instead.
Head and Shoulders vs Inverse Cup and Handle: what's the difference?
A head and shoulders has three peaks, the middle one highest. The handle can look like a right shoulder, so check the left side: a head and shoulders also has a comparable peak before the head, which is a distinct pointed high. With no left shoulder and one smooth arch, it is the inverse cup.
Head and Shoulders vs Inverse Head and Shoulders: what's the difference?
The same structure flipped: a head and shoulders forms three peaks with the highest in the middle after an uptrend and breaks down through its neckline. The inverse version has three troughs with the lowest in the middle after a downtrend and breaks up. Check which way the head points.
Head and Shoulders vs Triple Top: what's the difference?
In a head and shoulders the middle peak clearly exceeds the two outer ones. In a triple top all three peaks reach about the same level, so the resistance line through them is roughly flat rather than bending around a taller head.
How reliable is the head and shoulders pattern?
The head and shoulders is the most studied chart pattern in the technical analysis literature and one of the few with support from outside it — academic work on technical patterns has tended to find head-and-shoulders formations among the more statistically interesting, though findings differ by market and period and several studies conclude any edge is small once trading costs are included. Two caveats matter more than the numbers. First, almost every quoted success rate is measured from a confirmed neckline break, while a large share of real-world failures come from traders acting before that break — those failures never appear in the statistics. Second, pattern identification is partly subjective: how level the shoulders must be, and how the neckline is drawn, materially change which formations qualify. The pattern's genuine strengths are an unambiguous completion trigger and a clearly defined invalidation level, which is more than most patterns offer.
References
- Thomas N. Bulkowski. Encyclopedia of Chart Patterns . Wiley , 2005 . ISBN 978-0471668268.
- Robert D. Edwards, John Magee and W.H.C. Bassetti. Technical Analysis of Stock Trends . Routledge , 2018 . ISBN 978-1138069411.
- Andrew W. Lo, Harry Mamaysky and Jiang Wang. Foundations of Technical Analysis: Computational Algorithms, Statistical Inference, and Empirical Implementation . The Journal of Finance , 2000 .
Frequently asked questions
When is a head and shoulders pattern confirmed?
How do you set a target for a head and shoulders?
Do the two shoulders have to be the same height?
What is an inverse head and shoulders?
Is the head and shoulders pattern reliable?
Practise spotting the head and shoulders
Reading about a pattern is not the same as recognising it under time pressure. Chart Guess drills 53 patterns as a 60-second game — read the chart, call BUY or SELL, get the pattern name instantly.