Diamond Top Chart Pattern
A diamond top is a bearish reversal pattern that forms after an advance: price swings first widen into higher highs and lower lows, then narrow into lower highs and higher lows, and a close below the lower-right edge confirms the turn.
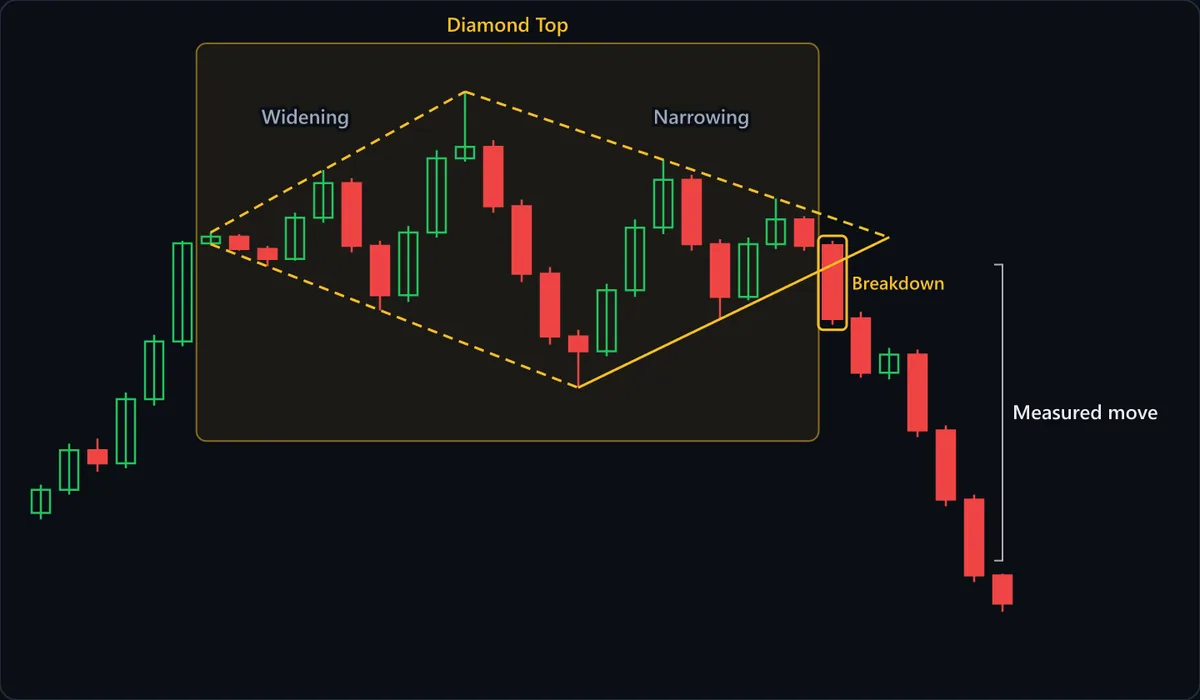
Chart data
| # | Open | High | Low | Close |
|---|---|---|---|---|
| 1 | 93.4 | 95.1 | 93 | 94.8 |
| 2 | 94.8 | 97.6 | 94.5 | 97.2 |
| 3 | 97.2 | 97.9 | 95.9 | 96.4 |
| 4 | 96.4 | 100.7 | 96.1 | 100.3 |
| 5 | 100.3 | 104.2 | 99.9 | 103.8 |
| 6 | 103.8 | 109.9 | 103.5 | 109.75 |
| 7 | 109.75 | 110.4 | 109.7 | 110.15 |
| 8 | 110.15 | 110.3 | 109.3 | 109.4 |
| 9 | 109.4 | 109.6 | 108.36 | 108.8 |
| 10 | 108.8 | 111.6 | 108.7 | 111.3 |
| 11 | 111.3 | 114.2 | 111 | 113.4 |
| 12 | 113.4 | 113.7 | 109.2 | 109.6 |
| 13 | 109.6 | 109.9 | 105.68 | 106.6 |
| 14 | 106.6 | 110.8 | 106.2 | 110.4 |
| 15 | 110.4 | 115.4 | 110.1 | 114.9 |
| 16 | 114.9 | 118.95 | 114.7 | 115.6 |
| 17 | 115.6 | 116 | 111.6 | 112 |
| 18 | 112 | 112.4 | 107.4 | 107.9 |
| 19 | 107.9 | 108.3 | 103.6 | 104.1 |
| 20 | 104.1 | 104.5 | 100.99 | 103.2 |
| 21 | 103.2 | 107.3 | 102.9 | 106.9 |
| 22 | 106.9 | 111.2 | 106.5 | 110.7 |
| 23 | 110.7 | 114.82 | 110.3 | 113.6 |
| 24 | 113.6 | 113.9 | 109.3 | 109.7 |
| 25 | 109.7 | 110 | 105.14 | 106.5 |
| 26 | 106.5 | 110.1 | 106.3 | 109.7 |
| 27 | 109.7 | 112.46 | 109.4 | 111.2 |
| 28 | 111.2 | 111.4 | 109.3 | 109.6 |
| 29 | 109.6 | 109.9 | 104.8 | 105.2 |
| 30 | 105.2 | 105.6 | 101.6 | 101.9 |
| 31 | 101.9 | 103.4 | 101.5 | 103 |
| 32 | 103 | 103.3 | 98 | 98.4 |
| 33 | 98.4 | 98.7 | 93.8 | 94.2 |
| 34 | 94.2 | 94.5 | 89.2 | 89.6 |
| 35 | 89.6 | 89.7 | 87.4 | 87.9 |
At a glance
| Type | Bearish reversal |
|---|---|
| Direction | Bearish |
| Bars required | Multiple bars |
| Family | Chart pattern |
| Evidence | Moderate |
| Also called | diamond top pattern, bearish diamond pattern, diamond top formation, diamond reversal top |
What timeframe does it work on?
A diamond needs several complete swings on each side, so it takes far more bars to form than a double top or a flag. On low intraday timeframes, ordinary choppy ranges produce widening-then-narrowing swings all the time, and lines drawn through them describe noise. The pattern carries more weight on daily and weekly charts, where the wide middle swings reflect sessions of genuine dispute after a climactic rally.
Anatomy of the pattern
- The prior rally — A steep advance leads into the pattern, as in the run of green candles on the left of the chart. A diamond is a topping structure, so without a meaningful rise to reverse there is nothing for it to signal.
- Widening — The left half is a broadening formation: each swing high is higher and each swing low is lower than the last. Expanding volatility at the top says neither side is in control.
- The widest point — The highest high and the lowest low inside the pattern mark the diamond's middle. The vertical distance between them is the pattern's height, and it is the number the measured move is built from.
- Narrowing — The right half contracts like a symmetrical triangle, with lower highs and higher lows. The dispute is settling below the peak: in the chart each rebound here stalls lower than the one before.
- Breakdown — A candle closes below the solid lower-right trendline, the line joining the lowest low to the higher low after it. That close, not the shape alone, is what turns a symmetrical diamond into a bearish signal.
- Measured move — The diamond's widest height is subtracted from the price where the lower-right line was broken. The bracket on the chart shows that projection, a planning reference rather than a forecast.
How to identify it
- A clear advance precedes the structure; a diamond drawn in the middle of a sideways range is not a top.
- The left half shows at least one higher high and one lower low after the rally, so the swings visibly widen.
- The right half shows at least one lower high and one higher low, so the swings visibly narrow back toward a point.
- Four trendlines, two diverging and two converging, enclose the swings without forcing lines through the middle of candles.
- Volume, where available, tends to be heavy through the widening half, fades into the narrowing half and expands on the break.
- The breakdown is a candle close below the lower-right trendline, not just a wick through it.
How to trade it
Entry. Sell on a close below the diamond's lower-right trendline, or on a retest of that line from below after the break. The close is the confirmation; selling inside the narrowing half anticipates a direction the pattern has not chosen yet, since the contracting right side can still break upward.
Stop. Above the last swing high inside the narrowing half. That high is the most recent level where sellers turned price down within the contraction, so a move back above it means the right side has failed to hold and the bearish reading no longer stands. It sits much closer than the diamond's peak, which keeps the risk proportionate.
Target. Take the diamond's widest height, from its highest high to its lowest low, and subtract it from the breakout point on the lower-right line. Treat the result as a reference and check what lies between: the lowest low of the widening half always sits between the breakout and the target, and it can slow the decline on its own.
What invalidates it
- Price closes above the upper-right trendline. The contraction has resolved upward, and the structure is better read as a pause within the uptrend than as a top.
- Price breaks below the lower-right line, then quickly closes back above it and above the last swing high in the narrowing half. The breakdown has failed, and the stop level has been reclaimed.
- The right half never contracts. If swings keep widening, you are still inside a broadening formation, and trading it as a completed diamond is premature.
- There was no real advance before the pattern. Without a rally to reverse, the widening-then-narrowing swings are just a volatile range.
Often confused with
Diamond Top vs Broadening Top: what's the difference?
A broadening top keeps widening, with higher highs and lower lows all the way through. A diamond starts the same way but then contracts; until you see lower highs and higher lows on the right, you are looking at a broadening top, not a diamond.
Diamond Top vs Head and Shoulders: what's the difference?
Both have a highest peak flanked by lower ones, but a head and shoulders breaks a roughly horizontal or gently sloped neckline under both shoulders. A diamond's lows also diverge then converge, so its break comes through a rising lower-right line rather than a flat neckline.
Diamond Top vs Symmetrical Triangle: what's the difference?
A symmetrical triangle contracts from its first swing, while a diamond's contraction follows a widening phase. If the swings that precede the converging lines are themselves expanding at the top of a rally, the triangle is the right half of a diamond.
How reliable is the diamond top pattern?
The diamond top is a recognized formation in the classic chart-pattern references, which describe it as rare and found mainly at tops after active advances. Moderate is the honest tier because the pattern has defined criteria, a widening half, a narrowing half and a trendline break, but applying them involves judgment: where the widening ends and the narrowing starts, and which swings anchor the four lines, changes both the breakout level and the measured move. Its rarity also means far fewer clean examples exist to study than for double tops or flags, and many shapes traders call diamonds are untidy head and shoulders tops or plain volatile ranges. Its one firm virtue is a clear decision point at the lower-right line.
References
- Thomas N. Bulkowski. Encyclopedia of Chart Patterns . Wiley , 2005 . ISBN 978-0471668268.
- Robert D. Edwards, John Magee and W.H.C. Bassetti. Technical Analysis of Stock Trends . Routledge , 2018 . ISBN 978-1138069411.
Frequently asked questions
What does a diamond top mean?
Is a diamond top bullish or bearish?
How do you trade a diamond top?
What is the difference between a diamond top and a diamond bottom?
How reliable is the diamond top?
Practise spotting the diamond top
Reading about a pattern is not the same as recognising it under time pressure. Chart Guess drills 53 patterns as a 60-second game — read the chart, call BUY or SELL, get the pattern name instantly.