Rising Wedge Pattern
A rising wedge is a bearish chart pattern in which price makes higher highs and higher lows between two upward-sloping trendlines that converge, because the lows rise faster than the highs. It is confirmed when price closes below the lower line.
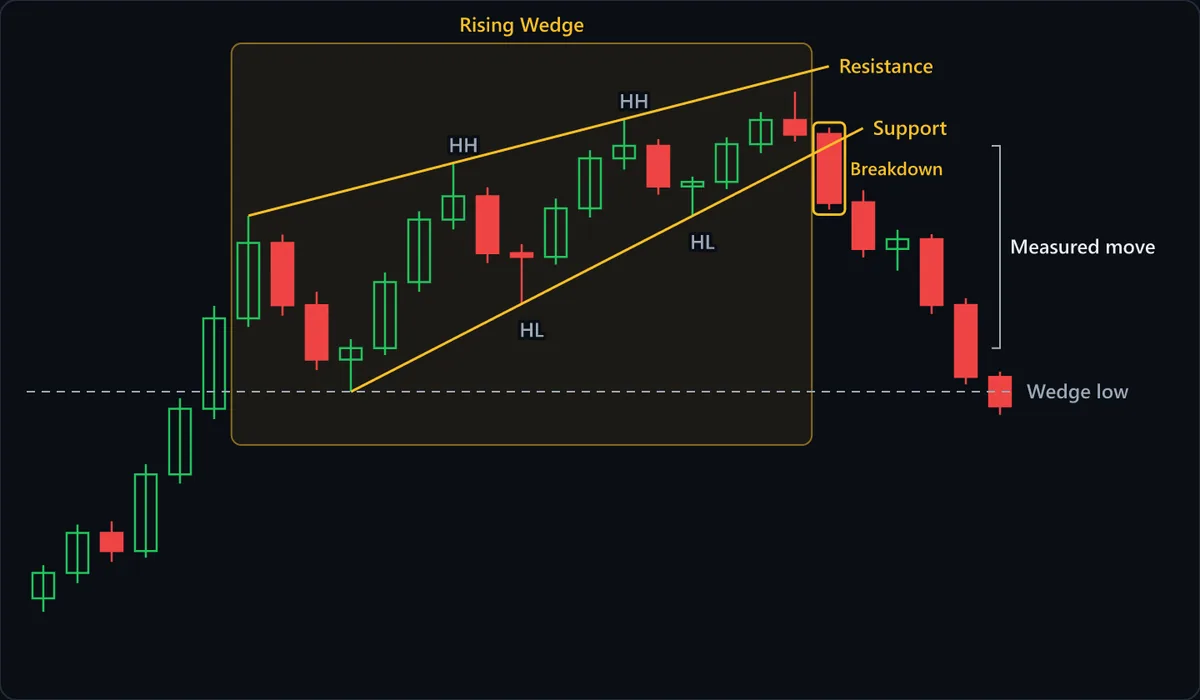
Chart data
| # | Open | High | Low | Close |
|---|---|---|---|---|
| 1 | 86.18 | 88.07 | 85.42 | 87.63 |
| 2 | 87.63 | 90.38 | 87.05 | 89.91 |
| 3 | 89.91 | 90.57 | 88.26 | 88.87 |
| 4 | 88.87 | 93.82 | 88.49 | 93.24 |
| 5 | 93.24 | 97.58 | 92.71 | 96.97 |
| 6 | 96.97 | 102.83 | 96.38 | 102.12 |
| 7 | 102.12 | 107.96 | 101.63 | 106.41 |
| 8 | 106.41 | 106.88 | 102.27 | 102.86 |
| 9 | 102.86 | 103.62 | 99.18 | 99.77 |
| 10 | 99.77 | 100.93 | 97.94 | 100.42 |
| 11 | 100.42 | 104.73 | 100.03 | 104.18 |
| 12 | 104.18 | 108.21 | 103.62 | 107.74 |
| 13 | 107.74 | 110.96 | 107.18 | 109.07 |
| 14 | 109.07 | 109.58 | 105.27 | 105.83 |
| 15 | 105.83 | 106.34 | 102.94 | 105.61 |
| 16 | 105.61 | 108.93 | 105.17 | 108.38 |
| 17 | 108.38 | 111.68 | 107.86 | 111.22 |
| 18 | 111.22 | 113.46 | 110.58 | 111.93 |
| 19 | 111.93 | 112.31 | 109.16 | 109.62 |
| 20 | 109.62 | 110.18 | 107.94 | 109.88 |
| 21 | 109.88 | 112.42 | 109.47 | 112.03 |
| 22 | 112.03 | 113.86 | 111.52 | 113.41 |
| 23 | 113.41 | 115.02 | 112.18 | 112.57 |
| 24 | 112.57 | 112.98 | 108.31 | 108.72 |
| 25 | 108.72 | 109.41 | 105.58 | 106.07 |
| 26 | 106.07 | 107.16 | 104.83 | 106.62 |
| 27 | 106.62 | 106.91 | 102.37 | 102.88 |
| 28 | 102.88 | 103.27 | 98.36 | 98.79 |
| 29 | 98.79 | 99.08 | 96.63 | 97.12 |
At a glance
| Type | Bearish reversal |
|---|---|
| Direction | Bearish |
| Bars required | Multiple bars |
| Family | Chart pattern |
| Evidence | Moderate |
| Also called | rising wedge pattern, ascending wedge, bearish wedge |
What timeframe does it work on?
Rising wedges appear on intraday, daily and weekly charts, but the pattern needs at least two clean touches on each line to mean anything, and on a 5-minute chart those can come from a few noisy bars. The classic references describe daily-chart wedges taking several weeks to a few months; one that grinds on much longer has usually become a broad channel. On any timeframe, judge the breakdown by a close, not a wick.
Anatomy of the pattern
- Resistance — The upper line, across the rising highs. It climbs more slowly than support, so each new high clears the last by a smaller margin: buyers are getting less for every push.
- Support — The lower line, across the rising lows, and steeper than resistance. Dips are bought at ever higher prices, which looks strong but squeezes the range from below toward the apex.
- HH and HL swings — The higher highs and higher lows that make the wedge look like a healthy uptrend. Each is a touch on its line; with fewer than two per side, you have a rally with lines drawn on it.
- Breakdown — The first close below support. Here it arrives roughly two-thirds of the way from the wedge's start to the apex, right after a final rally stalled short of resistance.
- Measured move — One common target: the wedge's widest height, where the pattern began, projected down from the breakdown point. Take it or the Wedge low, whichever is nearer, as the first objective.
- Wedge low — The lowest point inside the wedge, where the advance it contained began. A decline back to it gives back that whole advance, and it is the other common target.
How to identify it
- Price is making higher highs and higher lows, and one line fits at least two of the highs while another fits at least two of the lows.
- Both lines slope upward, but the lower line is steeper, so the distance between them shrinks as the pattern moves right.
- Each new high exceeds the last by less than before, and late in the pattern rallies stall below the upper line or barely reach it.
- Where volume is available, it tends to fade as the wedge narrows; heavy volume on the new highs argues against the pattern.
- The setting is a mature advance or a counter-trend bounce inside a downtrend, not the first leg of a new rally out of a base.
- The breakdown is a close below the lower line, usually before price has squeezed all the way into the apex.
How to trade it
Entry. Sell on a close below the lower (support) trendline, or on a failed retest of that line from below. The close matters because wedge support is a sloped line drawn by eye, and intraday pokes through it are common. The retest offers a better price and a clearer stop, but some breakdowns never come back. Shorting the upper line in anticipation bets against an advance that has not yet failed.
Stop. Above the last swing high inside the wedge, here the final push that stalled under resistance. That high is the buyers' last attempt; a move back above it says the rally has resumed. A stop just above the broken support line is tighter, but that is exactly where retests trade.
Target. Two common targets: the wedge's widest height, measured at its start, projected down from the break, and the wedge's starting low, where the advance it contained began. Take the nearer one as the first objective, and note any prior support sitting between entry and either level.
What invalidates it
- A close above the upper trendline on expanding volume. Buyers have broken the ceiling, and the premise of fading momentum is wrong.
- After a breakdown, price recovers above the last swing high inside the wedge. The break was a shakeout, not a failed advance.
- The lines are parallel, or the upper line is steeper. That is a channel or a broadening shape, without the wedge's exhaustion logic.
- Price drifts all the way into the apex without breaking. The range is then so narrow that a close below support means little.
- One of the lines has only a single real touch, so there is no defined structure to break.
Often confused with
Rising Wedge vs Ascending Channel: what's the difference?
Both climb between two rising lines. In an ascending channel the lines are parallel, so highs and lows advance at the same pace; in a rising wedge support rises faster and the range narrows. If the gap between your lines is not shrinking, it is a channel.
Rising Wedge vs Ascending Triangle: what's the difference?
An ascending triangle has a flat upper line, with buyers hitting the same ceiling repeatedly, and is usually read as bullish. A rising wedge's upper line also slopes up, just more slowly than support. A horizontal top makes it a triangle.
Rising Wedge vs Bear Flag: what's the difference?
Both slope upward and both are read as bearish, but a rising wedge's lines converge, the lower one climbing faster, it needs no pole, and it usually takes far longer to build. If the range is narrowing toward an apex, it is a wedge.
Rising Wedge vs Bear Pennant: what's the difference?
In a rising wedge both trendlines slope upward as price grinds higher. In a bear pennant the upper line slopes down and the lower line slopes up, so highs are falling while lows rise.
Rising Wedge vs Bearish Wolfe Wave: what's the difference?
A rising wedge is traded on a break of its lower line. A bearish Wolfe wave needs one extra event first: a fifth wave that briefly breaks above the upper 1-3 line and fails. Its target also comes from the sloping 1-4 line, not the classic wedge expectation of a retrace to the wedge's starting point.
Rising Wedge vs Bull Pennant: what's the difference?
Each narrows toward an apex, but a rising wedge has both lines sloping upward, takes far more bars to build and needs no pole. A bull pennant's highs fall as its lows rise, and it is over in a handful of bars. The wedge is read as bearish.
Rising Wedge vs Falling Wedge: what's the difference?
The mirror image: both lines slope down and converge, and the expected break is upward. A rising wedge slopes up and is expected to break down. In both, the slope of the wedge points opposite to the break traders watch for.
Rising Wedge vs Symmetrical Triangle: what's the difference?
Both lines of a rising wedge slope upward, with highs and lows each climbing. In a symmetrical triangle the lines point toward each other from opposite directions, one falling and one rising.
How reliable is the rising wedge pattern?
Wedges are covered in all the standard chart-pattern references, and the rising wedge is consistently described as bearish whether it forms at the top of an advance or as a bounce inside a downtrend. The tier is moderate rather than well documented because the pattern is harder to define objectively than a flag. Everything rests on two sloped trendlines through touch points the trader chooses, and connecting a different pair of highs or lows moves the breakdown level, sometimes changing whether a break has happened at all. References also differ on how many touches are required. Two behaviors are widely noted: price often pulls back to the underside of the broken support line, and some rising wedges resolve upward instead. Results depend heavily on the exact rules used, so no success rate is quoted here.
References
- Thomas N. Bulkowski. Encyclopedia of Chart Patterns . Wiley , 2005 . ISBN 978-0471668268.
- Robert D. Edwards, John Magee and W.H.C. Bassetti. Technical Analysis of Stock Trends . Routledge , 2018 . ISBN 978-1138069411.
- John J. Murphy. Technical Analysis of the Financial Markets . New York Institute of Finance , 1999 . ISBN 978-0735200661.
Frequently asked questions
What does a rising wedge mean?
Is a rising wedge bullish or bearish?
How do you trade a rising wedge?
What happens after a rising wedge breaks down?
Can a rising wedge break upward?
Practise spotting the rising wedge
Reading about a pattern is not the same as recognising it under time pressure. Chart Guess drills 53 patterns as a 60-second game — read the chart, call BUY or SELL, get the pattern name instantly.