Bear Flag Pattern
A bear flag is a bearish continuation pattern in which a steep sell-off, the pole, is followed by a brief, narrow bounce drifting up or sideways between parallel lines, and a close below the bounce's lower line signals the decline resuming.
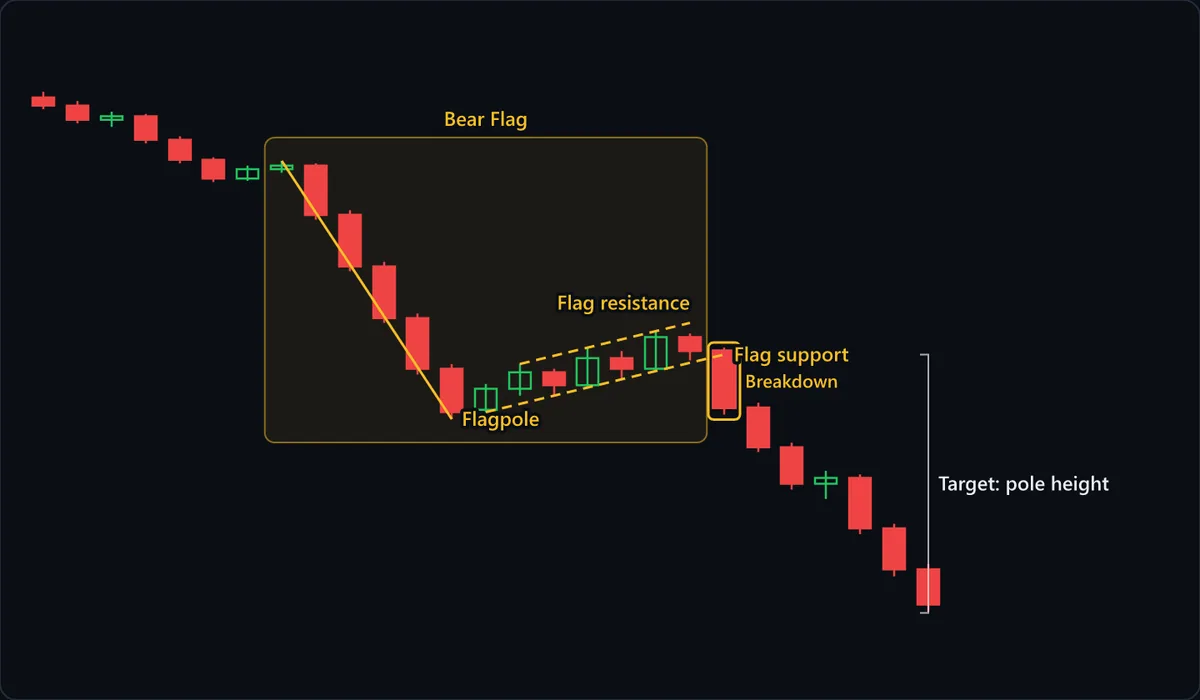
Chart data
| # | Open | High | Low | Close |
|---|---|---|---|---|
| 1 | 129.4 | 129.9 | 128.4 | 128.7 |
| 2 | 128.7 | 129.1 | 127.2 | 127.5 |
| 3 | 127.5 | 128.2 | 126.9 | 127.8 |
| 4 | 127.8 | 128 | 125.5 | 125.8 |
| 5 | 125.8 | 126.1 | 123.8 | 124.1 |
| 6 | 124.1 | 124.3 | 122.2 | 122.5 |
| 7 | 122.5 | 123.6 | 122.3 | 123.3 |
| 8 | 123.3 | 124 | 123 | 123.6 |
| 9 | 123.6 | 123.8 | 119 | 119.4 |
| 10 | 119.4 | 119.8 | 114.6 | 115 |
| 11 | 115 | 115.4 | 110.2 | 110.6 |
| 12 | 110.6 | 111 | 105.8 | 106.3 |
| 13 | 106.3 | 106.7 | 102 | 102.6 |
| 14 | 102.8 | 105 | 102.6 | 104.6 |
| 15 | 104.6 | 106.7 | 104 | 106 |
| 16 | 106 | 106.3 | 104 | 104.9 |
| 17 | 104.9 | 108.1 | 104.8 | 107.2 |
| 18 | 107.2 | 107.8 | 105.4 | 106.3 |
| 19 | 106.3 | 109.5 | 106.2 | 109 |
| 20 | 109 | 109.3 | 107 | 107.8 |
| 21 | 107.8 | 108.1 | 102.4 | 103 |
| 22 | 103 | 103.4 | 99.2 | 99.6 |
| 23 | 99.6 | 100 | 96 | 96.5 |
| 24 | 96.5 | 97.6 | 95.2 | 97 |
| 25 | 97 | 97.3 | 92.2 | 92.7 |
| 26 | 92.7 | 93.1 | 88.6 | 89.2 |
| 27 | 89.2 | 89.7 | 85.6 | 86.2 |
At a glance
| Type | Continuation |
|---|---|
| Direction | With the trend |
| Bars required | Multiple bars |
| Family | Chart pattern |
| Evidence | Well documented |
| Also called | bear flag pattern, bearish flag, bear flag chart pattern |
What timeframe does it work on?
Bear flags appear on one-minute charts and weeklies alike; the rules scale with the bars, not the clock. On very low timeframes a pole can be one burst of forced selling in thin liquidity, which says less than a pole built over several daily sessions. Declines often unfold faster than advances, so bear flags tend to be briefer than bull flags on the same chart.
Anatomy of the pattern
- Flagpole — Five wide red candles drop along the solid line, each opening near the prior close. The drop strands dip-buyers with losses and leaves sellers who missed it waiting for a better price; both groups later sell into the bounce. The slower decline to its left matters too: the pattern lives inside an existing downtrend.
- Flag resistance — The dashed upper line joins the bounce's highs and rises at the same angle as the line beneath it. Each push higher is sold back: lift without conviction, which is what short covering and bargain hunting look like.
- Flag support — The dashed lower line under the bounce's lows, extended past the flag so the break is easy to judge. The red candle just before the breakdown falls off the channel's top but still closes above support, so it is a warning, not the signal.
- Breakdown — The outlined candle opens just above Flag support and closes well below it, near where the bounce began, erasing most of the flag in one bar. A decisive close, not a wick dipping through, is what separates a breakdown from chop.
- Target: pole height — The bracket copies the flagpole's height and hangs it from the breakdown point. The diagram is drawn to reach it; real breakdowns often pause first at the pole's low, which here sits just beneath the Breakdown candle's close.
How to identify it
- A fast decline of mostly consecutive red candles comes first, steep enough that one straight line covers it, like the Flagpole line in the diagram.
- The bounce rises or moves sideways between two roughly parallel lines; converging lines point to a pennant or rising wedge instead.
- The flag's highest point recovers less than about half the pole, measured from the pole's top to its low.
- Flag candles are smaller than the pole's and overlap, green and red mixed: a grind higher, not a rally.
- Where volume is shown, it typically fades through the bounce and often expands on the breakdown, though a downside break can still be valid on modest volume.
- The bounce stays brief, a handful of bars against the pole, rather than grinding on into a new uptrend.
- The trigger is a candle closing below Flag support, not a wick poking through it.
How to trade it
Entry. Sell on a close below the flag's lower trendline, or on the first bounce back up into that line after the break. That line is the only support the bounce has, so closing below it means the buyers propping price up have stepped away. The retest offers a better price and nearer stop but misses breakdowns that never look back.
Stop. Above the flag's high, the furthest the bounce reached. Trading beyond it shows more buying conviction than a short-covering rally should have, and the premise is gone. A stop inside the channel gets hit by its normal back-and-forth; a tall flag calls for a smaller position, not a tighter stop.
Target. Subtract the pole's height, top to low, from the breakdown point. The convention assumes the flag forms roughly midway through the decline, the old idea that flags fly at half-mast. Because the flag drifts upward, the pole's low lies between entry and target and is the first level that can stop the move.
What invalidates it
- A close above the flag's high. Buyers reached further than weak short covering explains, and the stop sits exactly there.
- The bounce recovers more than half the pole. Sellers have surrendered too much of the drop for a pause, and a reversal may be forming.
- A V-shaped recovery: large green candles climbing steeply instead of overlapping in a channel. That is buying with conviction, the opposite of a flag.
- The breakdown does not hold and price closes back inside the channel within a bar or two. Trapped late sellers can fuel a sharp squeeze higher.
- There was no real pole, only a gradual decline. A small rising channel without a sharp drop before it is a minor uptrend, not a pause.
Often confused with
Bear Flag vs Bear Pennant: what's the difference?
Both hang off a steep drop and break lower; the shape of the pause is the tell. A bear flag's boundaries run parallel and usually tilt upward, while a bear pennant's converge into a small symmetrical triangle. Entry, stop and pole-height target are handled the same way.
Bear Flag vs Bull Flag: what's the difference?
The same structure pointing the other way, and in both the flag slopes against the trend: a bear flag's bounce drifts up, a bull flag's pullback drifts down. Judged alone, either flag looks like a reversal, so read the direction from the pole.
Bear Flag vs Inverse Cup and Handle: what's the difference?
The handle can resemble a small bear flag, so look at what came before it. A bear flag hangs off a steep, nearly straight drop; the handle follows a slow, curved rollover from a dome.
Bear Flag vs Rising Wedge: what's the difference?
Both slope upward and both are read as bearish, but a rising wedge's lines converge, the lower one climbing faster, it needs no pole, and it usually takes far longer to build. If the range is narrowing toward an apex, it is a wedge.
How reliable is the bear flag pattern?
The bear flag sits in the same tier as its bullish mirror for the same reason: a steep pole, a bounded bounce, parallel boundaries and a defined breakdown line are objective criteria that can be tested consistently, and the standard references treat flags in falling markets alongside rising ones. One nuance belongs to the bearish side. A long-standing rule of thumb holds that downside breaks need less volume confirmation, since prices can fall when buyers simply stop showing up, so a quiet breakdown is weaker evidence rather than a disqualifier. Published results still depend on the depth, duration and confirmation rules chosen, and many charts labeled bear flags are ordinary bounces after a slow decline with no steep pole. The clear failure point, a close above the flag's high, is the pattern's practical strength.
References
- Thomas N. Bulkowski. Encyclopedia of Chart Patterns . Wiley , 2005 . ISBN 978-0471668268.
- Robert D. Edwards, John Magee and W.H.C. Bassetti. Technical Analysis of Stock Trends . Routledge , 2018 . ISBN 978-1138069411.
- John J. Murphy. Technical Analysis of the Financial Markets . New York Institute of Finance , 1999 . ISBN 978-0735200661.
Frequently asked questions
What does a bear flag mean?
Is a bear flag bullish or bearish?
How do you trade a bear flag?
Does a bear flag need confirmation?
What happens if a bear flag fails?
Practise spotting the bear flag
Reading about a pattern is not the same as recognising it under time pressure. Chart Guess drills 53 patterns as a 60-second game — read the chart, call BUY or SELL, get the pattern name instantly.