Bull Pennant Pattern
A bull pennant is a bullish continuation pattern in two parts: a sharp rally, called the pole, and the small, short-lived symmetrical triangle of lower highs and higher lows that follows it; a close above the triangle's upper line is read as the rally resuming.
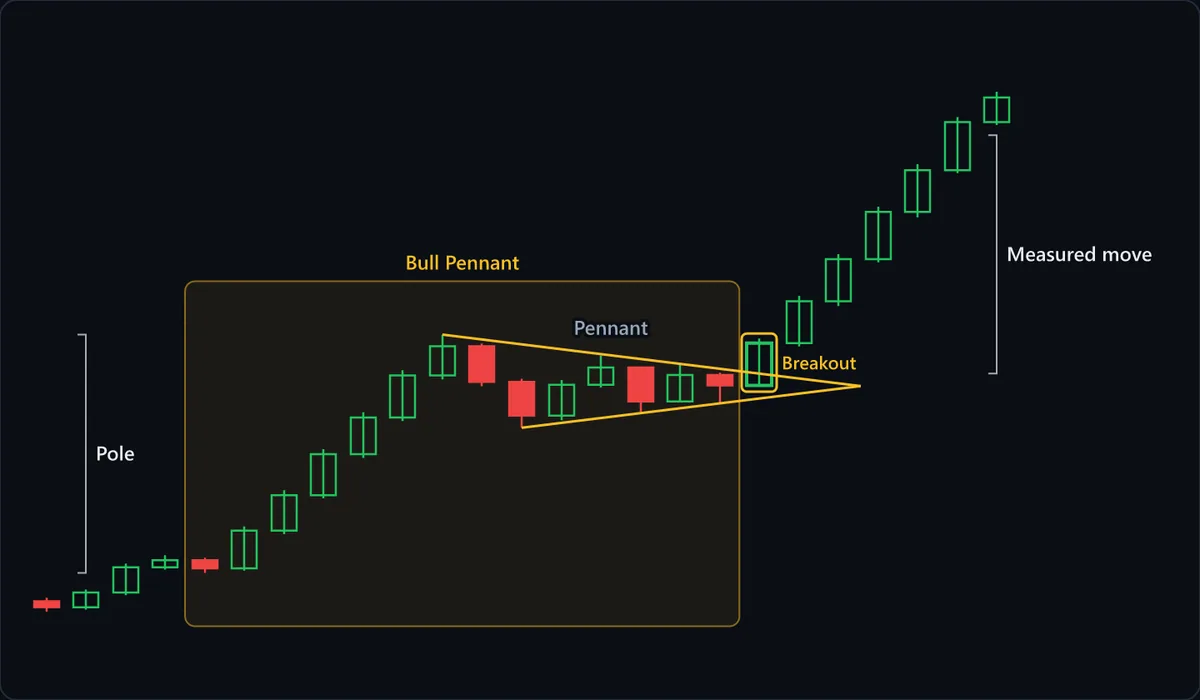
Chart data
| # | Open | High | Low | Close |
|---|---|---|---|---|
| 1 | 81.38 | 81.71 | 80.42 | 80.83 |
| 2 | 80.83 | 82.46 | 80.61 | 82.19 |
| 3 | 82.19 | 84.87 | 81.94 | 84.52 |
| 4 | 84.52 | 85.63 | 84.31 | 85.18 |
| 5 | 85.18 | 85.41 | 84 | 84.43 |
| 6 | 84.43 | 88.29 | 84.22 | 87.91 |
| 7 | 87.91 | 91.64 | 87.58 | 91.17 |
| 8 | 91.17 | 95.42 | 90.88 | 94.96 |
| 9 | 94.96 | 98.83 | 94.61 | 98.34 |
| 10 | 98.34 | 102.71 | 98.02 | 102.23 |
| 11 | 102.23 | 106 | 101.87 | 104.92 |
| 12 | 104.92 | 105.18 | 101.23 | 101.64 |
| 13 | 101.64 | 101.93 | 97.4 | 98.52 |
| 14 | 98.52 | 101.81 | 98.09 | 101.37 |
| 15 | 101.37 | 104.08 | 101.12 | 102.96 |
| 16 | 102.96 | 103.05 | 98.87 | 99.83 |
| 17 | 99.83 | 103.3 | 99.78 | 102.28 |
| 18 | 102.28 | 102.49 | 99.65 | 101.31 |
| 19 | 101.31 | 105.63 | 101.19 | 105.22 |
| 20 | 105.22 | 109.58 | 104.91 | 109.07 |
| 21 | 109.07 | 113.42 | 108.63 | 112.96 |
| 22 | 112.96 | 117.81 | 112.68 | 117.33 |
| 23 | 117.33 | 121.74 | 116.82 | 121.18 |
| 24 | 121.18 | 126.07 | 120.91 | 125.62 |
| 25 | 125.62 | 128.43 | 125.34 | 127.88 |
At a glance
| Type | Continuation |
|---|---|
| Direction | With the trend |
| Bars required | Multiple bars |
| Family | Chart pattern |
| Evidence | Moderate |
| Also called | bull pennant pattern, bullish pennant, bull pennant formation |
What timeframe does it work on?
Bull pennants appear on any timeframe, but by definition the pause is brief in bars: a handful of one-minute candles, or a week or two of daily ones. They matter most in fast markets, right after a news-driven jump or a range breakout. On the lowest timeframes, ordinary noise can sketch a tiny triangle, so the pole must clearly stand out.
Anatomy of the pattern
- Pole — Six straight green candles, each closing near its high. The pole supplies what the triangle lacks: a direction, late buyers hunting for a dip, and the length for the target. A slow, choppy climb provides none of that.
- Pennant — Seven candles of shrinking swings between a falling upper line, drawn from the pole's top, and a rising lower line from the first pullback's low; three swings touch each. The deepest dip gives back less than half the pole: settling, not reversing.
- Apex — Where the lines meet, two or three candles to the right of the breakout. A pennant should break before price gets there, while the range still means something; one that drifts sideways out of its tip has fizzled.
- Breakout — The outlined candle opens inside the pennant and closes well above the upper line, though still under the pole's top. The trigger is a close through the line, not a new high; waiting for one here meant paying more a candle later.
- Measured move — The right-hand bracket stacks the pole's height on the breakout point, the upper line's level on the breakout candle. Tradition says pennants form mid-advance, so the next leg should echo the pole. Price overshoots here: an illustration, not a forecast.
How to identify it
- A steep advance comes first: several large green candles with little overlap. No obvious pole means no pennant.
- Highs step down and lows step up, so the lines converge; each is touched at least twice, and every swing is smaller than the last.
- The pullback gives back less than half the pole, leaving the pennant near the top of the advance.
- It is brief, a few bars of pause rather than a slow squeeze that lets the pole's urgency fade.
- Volume, where your chart shows it, shrinks with the swings and jumps on the breakout.
- The breakout that counts is a close above the upper line, made before the apex; a wick through it that closes back inside does not.
How to trade it
Entry. The textbook entry is a close above the pennant's upper line. Insist on the close: near the apex the pennant is so tight that an ordinary wiggle can poke through and fall back. Buying inside the pennant before the break, especially at the apex, is the classic error, because some pennants break down or fizzle.
Stop. Below the pennant's lowest point, normally the first pullback's low, since every later low is higher. It is the floor the whole pause has respected, and a close under it leaves no pennant to trade. Depth sets the stop and the pole sets the target, so a deep pennant on a short pole puts a wide stop against a short target.
Target. Add the pole's height to the breakout point, the upper line's level on the breakout candle. Start the pole where the steep run began, not at an older low, or the target inflates. Then check the path: the pole's own high, just above the breakout, is the first test, and older highs can stop the move short.
What invalidates it
- A close below the pennant's lowest point. Rising lows showed buyers absorbing each dip; losing the first and deepest one hands the pause to sellers.
- Price slides sideways out of the apex with no decisive close above the upper line. Once the lines meet, there is nothing left to break.
- The pole is missing: a small triangle after a slow, choppy climb has no burst of buying to continue.
- The breakout is undone at once, the next candles closing back inside the pennant. A break that slips straight back has settled nothing; the pennant's low decides it.
Often confused with
Bull Pennant vs Bull Flag: what's the difference?
Both follow a steep rally, break upward and take their target from the pole; the boundaries are the tell. A bull flag's lines run parallel, usually tilting down, while a bull pennant's converge toward an apex. Same trade, different shape.
Bull Pennant vs Rising Wedge: what's the difference?
Each narrows toward an apex, but a rising wedge has both lines sloping upward, takes far more bars to build and needs no pole. A bull pennant's highs fall as its lows rise, and it is over in a handful of bars. The wedge is read as bearish.
Bull Pennant vs Symmetrical Triangle: what's the difference?
A bull pennant is a small symmetrical triangle with two extra conditions: a sharp pole right before it and a short life. A symmetrical triangle needs neither, takes far longer to form, and measures its target from its own widest point.
How reliable is the bull pennant pattern?
Edwards and Magee, Murphy and Bulkowski all cover the pennant, and both Murphy and Edwards and Magee count flags and pennants among the more dependable continuation patterns. It is rated moderate here, a notch below the bull flag, because what counts as a pennant shifts from source to source. The line between a pennant and a small symmetrical triangle is a duration convention, so two studies of pennants may not count the same patterns, and with so few swings, where to draw the lines is partly judgment. Two things stay unambiguous: the failure point, a close below the pennant's low, and the timing rule, since a pennant that reaches its apex unbroken has failed. The measured move is the softest part, resting on the tradition that pennants form mid-move.
References
- Thomas N. Bulkowski. Encyclopedia of Chart Patterns . Wiley , 2005 . ISBN 978-0471668268.
- Robert D. Edwards, John Magee and W.H.C. Bassetti. Technical Analysis of Stock Trends . Routledge , 2018 . ISBN 978-1138069411.
- John J. Murphy. Technical Analysis of the Financial Markets . New York Institute of Finance , 1999 . ISBN 978-0735200661.
Frequently asked questions
What does a bull pennant mean?
Is a bull pennant bullish or bearish?
How do you trade a bull pennant?
How long does a bull pennant last?
Bull pennant vs bear pennant: what is the difference?
Practise spotting the bull pennant
Reading about a pattern is not the same as recognising it under time pressure. Chart Guess drills 53 patterns as a 60-second game — read the chart, call BUY or SELL, get the pattern name instantly.