Ascending Triangle Pattern
An ascending triangle is a continuation pattern formed by a flat line of resistance capping a series of progressively higher lows. Buyers keep paying more each time price pulls back, and the pattern typically resolves with a breakout above the flat resistance.
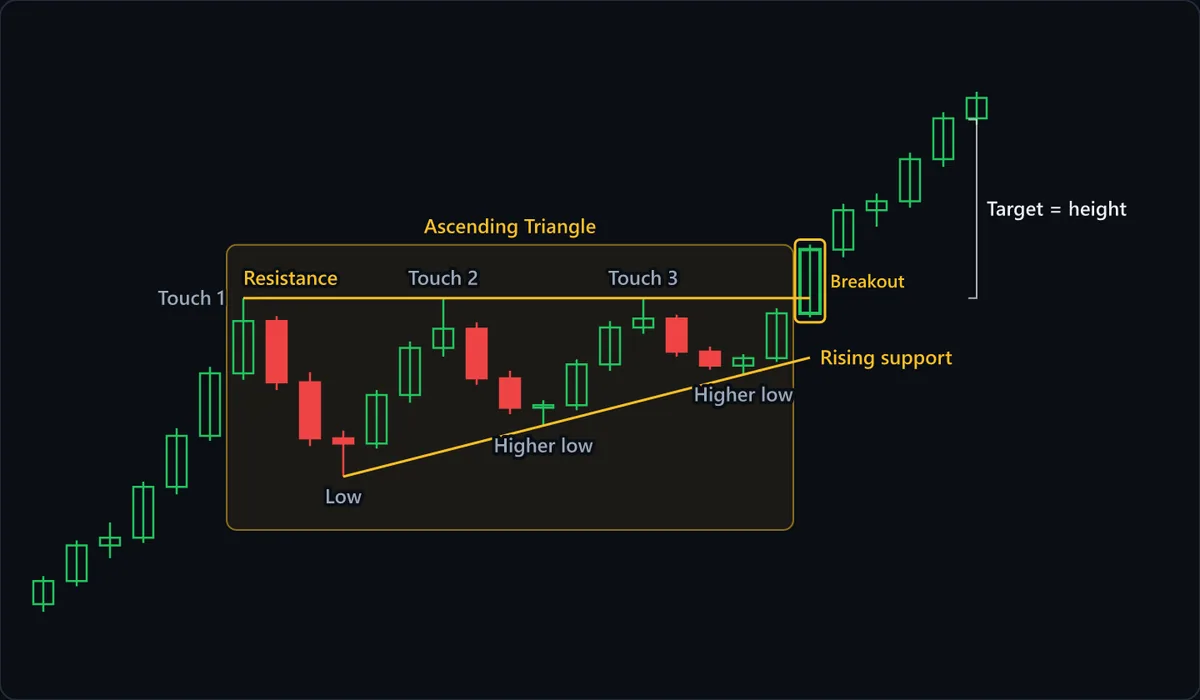
Chart data
| # | Open | High | Low | Close |
|---|---|---|---|---|
| 1 | 86 | 88.2 | 85.4 | 87.8 |
| 2 | 87.8 | 91 | 87.4 | 90.6 |
| 3 | 90.6 | 92.4 | 89.6 | 91.2 |
| 4 | 91.2 | 95.6 | 90.8 | 95.2 |
| 5 | 95.2 | 99.8 | 94.6 | 99.2 |
| 6 | 99.2 | 104.6 | 98.8 | 104.1 |
| 7 | 104.1 | 110 | 103.6 | 108.2 |
| 8 | 108.2 | 108.6 | 102.8 | 103.4 |
| 9 | 103.4 | 104.2 | 98.4 | 99 |
| 10 | 99 | 99.6 | 96 | 98.6 |
| 11 | 98.6 | 102.8 | 98.2 | 102.4 |
| 12 | 102.4 | 106.6 | 101.8 | 106.1 |
| 13 | 106.1 | 110 | 105.4 | 107.6 |
| 14 | 107.6 | 108.1 | 103.2 | 103.7 |
| 15 | 103.7 | 104.3 | 100.9 | 101.4 |
| 16 | 101.4 | 102 | 100 | 101.6 |
| 17 | 101.6 | 105.2 | 101.2 | 104.8 |
| 18 | 104.8 | 108.2 | 104.3 | 107.7 |
| 19 | 107.7 | 110 | 107.2 | 108.4 |
| 20 | 108.4 | 108.7 | 105.4 | 105.8 |
| 21 | 105.8 | 106.2 | 104.4 | 104.7 |
| 22 | 104.7 | 105.6 | 104 | 105.3 |
| 23 | 105.3 | 109.2 | 105 | 108.8 |
| 24 | 108.8 | 114.2 | 108.5 | 113.8 |
| 25 | 113.8 | 117.4 | 113.2 | 116.9 |
| 26 | 116.9 | 118.2 | 115.6 | 117.6 |
| 27 | 117.6 | 121.4 | 117.1 | 120.9 |
| 28 | 120.9 | 124.6 | 120.3 | 124.1 |
| 29 | 124.1 | 126.2 | 123.6 | 125.7 |
At a glance
| Type | Continuation |
|---|---|
| Direction | With the trend |
| Bars required | Multiple bars |
| Family | Chart pattern |
| Evidence | Well documented |
| Also called | ascending triangle pattern |
What timeframe does it work on?
It needs at least two touches of the flat resistance and two rising lows, so it takes a reasonable number of bars to form. The breakout usually comes about two-thirds of the way to the apex; triangles that drift all the way to the apex fail more often. Most of the classic literature studies daily and weekly charts. On intraday charts, small, noisy triangles are common, so apply the flat-ceiling and rising-lows criteria strictly before trusting one.
Anatomy of the pattern
- The ceiling — A roughly horizontal line of resistance, touched at least twice, where rallies repeatedly stall at the same price.
- Rising lows — Each pullback bottoms at a higher price than the last, drawn as an upward-sloping support line. This is the pattern's bullish tell: sellers are losing ground on every attempt.
- The convergence — The rising support line and the flat ceiling narrow the trading range over time, visually forming the triangle. Volume often contracts through this narrowing phase.
- The breakout — Price closes above the flat ceiling, ideally on expanding volume. This is what completes the pattern — triangles that lose the rising-lows structure before reaching the ceiling again are no longer forming this pattern.
- The measured move — The conventional target projects the triangle's height — measured at its widest point, from the ceiling down to the first low — upward from the breakout.
How to identify it
- A roughly horizontal resistance line has been touched at least twice at approximately the same price.
- At least two consecutive pullbacks bottom at progressively higher prices, forming a rising support line.
- The rising support and the flat ceiling are visibly converging rather than running parallel.
- Volume tends to contract as the range narrows, then expand on the eventual breakout.
- Price closes above the flat ceiling to complete the pattern.
How to trade it
Entry. The standard entry is a close above the flat ceiling. A more conservative alternative is to wait for a throwback and buy when price retests the broken ceiling as support. Avoid buying near the ceiling while price is still inside the triangle; that is where rallies have repeatedly stalled.
Stop. A close below the rising support line is the earliest sign of failure. Many traders place the protective stop just below the most recent rising low, which the line sits above.
Target. The measured move: take the triangle's height at its widest point (the ceiling minus the first low) and project that distance above the breakout price. Check for resistance levels between the entry and target, since they can interrupt the move before the projection is reached.
What invalidates it
- Price closes below the rising support line before reaching the ceiling again, especially on rising volume. The structure of higher lows has failed.
- The resistance line is not actually flat. A ceiling that slopes down while the lows rise is a symmetrical triangle, and one that rises while the lows rise faster is a rising wedge. Neither is an ascending triangle.
- Price breaks the ceiling intraday but closes back below it. Wicks through resistance that close back inside are a common source of failed triangle trades.
Often confused with
Ascending Triangle vs Ascending Channel: what's the difference?
An ascending triangle has a flat ceiling over rising lows, so the range narrows toward a breakout. In an ascending channel the ceiling climbs with the floor and the range stays roughly the same width. Flat top: triangle. Top rising parallel to the floor: channel. Rising but converging: rising wedge.
Ascending Triangle vs Bull Flag: what's the difference?
An ascending triangle narrows between a flat ceiling and rising support over many bars. No flat ceiling being repeatedly tested means it is not an ascending triangle; a steep pole followed by a short parallel channel, usually sloping slightly down, is what makes it a flag.
Ascending Triangle vs Horizontal Channel: what's the difference?
Both have a flat ceiling, but in an ascending triangle each low is higher than the last, so the floor slopes up and the swings shrink. In a horizontal channel the lows return to the same price and the box keeps its full height.
Ascending Triangle vs Rising Wedge: what's the difference?
In a rising wedge both lines slope upward and converge, the lows rising faster than the highs, and it is usually bearish. An ascending triangle has a horizontal ceiling.
Ascending Triangle vs Symmetrical Triangle: what's the difference?
In an ascending triangle the ceiling is flat and only the lows rise. In a symmetrical triangle the highs fall as the lows rise, so both lines slope toward each other.
How reliable is the ascending triangle pattern?
The ascending triangle is one of the more extensively studied continuation patterns in the chart-pattern literature. Large catalogued samples have found it breaks out upward more often than downward, consistent with its conventional bullish bias, though a meaningful share still break down. It most often appears as a continuation within an uptrend, but it can also form at the end of a decline as a bottom reversal; the breakout rules are the same. How often it breaks upward depends heavily on how strictly the resistance must be flat and the lows must rise to count as an ascending triangle. Loosen those criteria and the sample fills with noisier, less convincing shapes. The clearest practical strength of the pattern is not a guaranteed direction but a well-defined failure signal: a close below the rising support line before the ceiling is reached means the setup has failed.
References
- Thomas N. Bulkowski. Encyclopedia of Chart Patterns . Wiley , 2005 . ISBN 978-0471668268.
- Robert D. Edwards, John Magee and W.H.C. Bassetti. Technical Analysis of Stock Trends . Routledge , 2018 . ISBN 978-1138069411.
Frequently asked questions
Does an ascending triangle always break out upward?
What is the difference between an ascending triangle and a bull flag?
How do you set a target for an ascending triangle breakout?
What invalidates an ascending triangle before it breaks out?
Practise spotting the ascending triangle
Reading about a pattern is not the same as recognising it under time pressure. Chart Guess drills 53 patterns as a 60-second game — read the chart, call BUY or SELL, get the pattern name instantly.