Horizontal Channel Pattern
A horizontal channel, also called a rectangle, is a sideways pattern in which price swings between a flat resistance and a flat support, touching each at least twice, and resolves only when a candle closes outside one of those two lines.
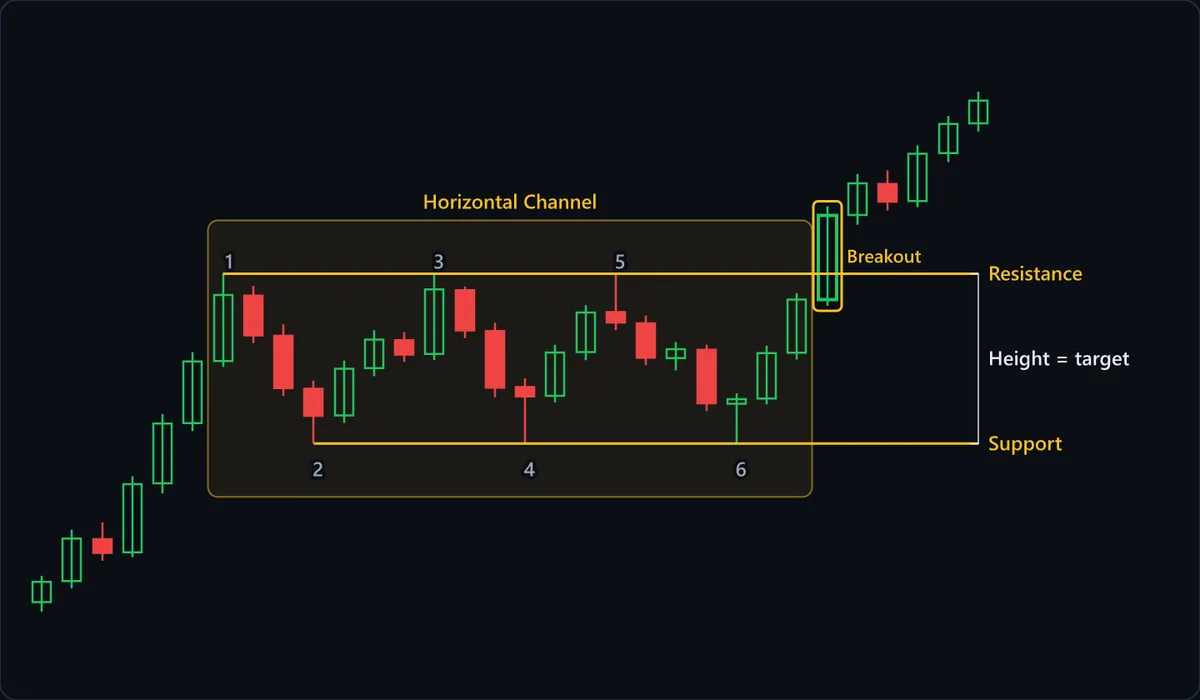
Chart data
| # | Open | High | Low | Close |
|---|---|---|---|---|
| 1 | 93.18 | 94.72 | 92.61 | 94.37 |
| 2 | 94.41 | 97.43 | 93.97 | 96.92 |
| 3 | 96.88 | 97.86 | 95.62 | 96.07 |
| 4 | 96.11 | 100.58 | 95.83 | 100.12 |
| 5 | 100.16 | 104.23 | 99.57 | 103.68 |
| 6 | 103.71 | 107.88 | 103.24 | 107.33 |
| 7 | 107.36 | 112.5 | 107.02 | 111.24 |
| 8 | 111.21 | 111.78 | 108.43 | 108.87 |
| 9 | 108.84 | 109.52 | 105.31 | 105.76 |
| 10 | 105.73 | 106.21 | 102.5 | 104.13 |
| 11 | 104.16 | 107.38 | 103.72 | 106.91 |
| 12 | 106.94 | 109.17 | 106.47 | 108.62 |
| 13 | 108.58 | 109.06 | 107.31 | 107.74 |
| 14 | 107.78 | 112.5 | 107.42 | 111.57 |
| 15 | 111.53 | 111.74 | 108.71 | 109.16 |
| 16 | 109.12 | 109.61 | 105.22 | 105.79 |
| 17 | 105.82 | 106.34 | 102.5 | 105.27 |
| 18 | 105.31 | 108.32 | 104.93 | 107.86 |
| 19 | 107.89 | 110.66 | 107.41 | 110.21 |
| 20 | 110.24 | 112.5 | 109.17 | 109.62 |
| 21 | 109.58 | 110.04 | 107.12 | 107.56 |
| 22 | 107.53 | 108.47 | 106.81 | 108.06 |
| 23 | 108.02 | 108.31 | 104.42 | 104.87 |
| 24 | 104.84 | 105.46 | 102.5 | 105.12 |
| 25 | 105.15 | 108.27 | 104.81 | 107.82 |
| 26 | 107.85 | 111.36 | 107.46 | 110.97 |
| 27 | 110.98 | 116.47 | 110.61 | 115.92 |
| 28 | 115.95 | 118.36 | 115.37 | 117.81 |
| 29 | 117.78 | 118.57 | 116.22 | 116.74 |
| 30 | 116.77 | 120.06 | 116.41 | 119.56 |
| 31 | 119.59 | 121.77 | 119.06 | 121.31 |
| 32 | 121.34 | 123.21 | 120.86 | 122.68 |
At a glance
| Type | Continuation |
|---|---|
| Direction | With the trend |
| Bars required | Multiple bars |
| Family | Chart pattern |
| Evidence | Well documented |
| Also called | rectangle pattern, rectangle chart pattern, trading range pattern, sideways channel |
What timeframe does it work on?
Ranges appear on every timeframe. On a 5-minute chart an opening range can print a clean six-touch channel in a couple of hours; on a daily chart the same box takes weeks and carries more weight, because more traders are anchored to the same two prices. The box must be tall enough that the trip from edge to edge pays for a stop just beyond the edge, a test narrow intraday ranges often fail.
Anatomy of the pattern
- Prior trend — The climb into touch 1 is what the range interrupts. After an advance the box is read first as a pause, which is why this example is classed as a continuation; after a long decline it would lean the other way.
- Resistance (1, 3, 5) — Three highs stall at one price. Touch 5 shows the typical shape: a long upper wick tags the line and the candle closes well back inside, sellers defending the level rather than a breakout.
- Support (2, 4, 6) — Three lows hold at one floor. Touches 4 and 6 leave long lower wicks that reach the line, and both candles close well above their lows, the rejection a range trader waits for before buying.
- The middle of the box — At the midpoint a long and a short are equally far from their targets, with no nearby level to hide a stop behind, which is why a mid-range entry gives you no clear place for the stop and only half the room to the target.
- Breakout — The highlighted candle opens inside the channel and closes several points above resistance. A close beyond the line ends the range; touch 5 already showed that a wick reaching the line can be rejected, so only a close beyond it counts.
- Height = target — The bracket measures resistance minus support. Added to the broken line it gives the breakout projection; inside the range it is simply the distance from one edge to the other.
How to identify it
- At least two separate highs reach the same resistance price and two separate lows reach the same support price; the example has three of each.
- Both lines are flat. Rising lows, falling highs or a tilted box mean a triangle, wedge or sloping channel instead.
- Swings usually travel from one boundary to near the other; a range where most swings stall halfway has weak edges.
- Wicks may overshoot a line slightly, but candle bodies keep closing back inside the box.
- The box is several typical candle ranges tall; a band a candle or two deep is congestion, not a tradable range.
- If you have volume, it usually tapers as the range matures, tends to be lightest mid-range, and should expand on a valid breakout.
How to trade it
Entry. There are two different trades. Inside the range, buy at support or sell at resistance only after a reversal candle confirms the edge, like the lower wicks at touches 4 and 6. For the breakout, wait for a close outside the box, then a retest of the broken line. The retest filters fakeouts at a cost: here price never came back to resistance, so the patient entry was missed.
Stop. Just beyond the boundary you traded from: under support for a long bought at the floor, back inside the box below broken resistance for a breakout long, and the mirror for shorts. A close through the floor you bought means the range is gone; a breakout that falls back inside was false.
Target. For a range trade, the opposite boundary, ideally exiting just before it, since that line has been defended before. For a breakout, project the channel height from the broken line, as the Height = target bracket shows. Check the measurement before entering: if the box is barely taller than your stop distance, neither trade is worth taking.
What invalidates it
- A candle closes outside the range. That ends the range trade at once, whichever edge you were positioned for; strong volume on that close makes the break more convincing.
- A breakout closes back inside the box within a candle or two. Ranges often end with this false break before the real one, and the failed side can run to the far boundary.
- The lines stop being flat. Highs stepping lower or lows stepping higher mean the range is compressing into a triangle, and the edge-to-edge trade loses its room.
- Swings start turning well short of the lines, a sign the levels have lost their pull and an order waiting at the edge may never fill.
Often confused with
Horizontal Channel vs Ascending Triangle: what's the difference?
Both have a flat ceiling, but in an ascending triangle each low is higher than the last, so the floor slopes up and the swings shrink. In a horizontal channel the lows return to the same price and the box keeps its full height.
Horizontal Channel vs Bull Flag: what's the difference?
A bull flag is brief and usually drifts slightly down against a steep pole. A horizontal channel is flat, usually lasts longer, can follow any trend, and is defined by repeated touches of both lines rather than by the impulse before it.
Horizontal Channel vs Descending Triangle: what's the difference?
A descending triangle keeps the flat floor but each rally peaks lower than the last. If resistance holds at one price on every test, as touches 1, 3 and 5 do here, it is a channel, not a triangle.
Horizontal Channel vs Triple Bottom: what's the difference?
A horizontal channel is a range that can form in any trend, usually with more touches of both boundaries, and often breaks out in the direction of the prior trend. Three touches of support become a triple bottom only after a downtrend, with two clear rallies between them and a close above the top.
Horizontal Channel vs Triple Top: what's the difference?
A horizontal channel is the same box of roughly equal highs and lows, and it can form in any trend, even after an advance. It reads as a triple top only when it caps an uptrend with three tests of resistance and then closes below trough support. Until then, it is a channel that can break either way.
How reliable is the horizontal channel pattern?
The rectangle is easy to test because its definition is close to mechanical. Two roughly flat lines, a minimum number of touches and a close beyond one of them can be coded with a few tolerance settings, which is why Lo, Mamaysky and Wang included rectangle tops and bottoms among the patterns they defined algorithmically. What is documented is the structure and the breakout, not a built-in direction: a range after an advance is conventionally expected to resolve upward, but the standard texts treat that as a lean, and breaks against the prior trend are common enough that you cannot assume the side. The practical weakness is the false break, where price pokes past a line, triggers stops, then closes back inside.
References
- Thomas N. Bulkowski. Encyclopedia of Chart Patterns . Wiley , 2005 . ISBN 978-0471668268.
- Robert D. Edwards, John Magee and W.H.C. Bassetti. Technical Analysis of Stock Trends . Routledge , 2018 . ISBN 978-1138069411.
- Andrew W. Lo, Harry Mamaysky and Jiang Wang. Foundations of Technical Analysis: Computational Algorithms, Statistical Inference, and Empirical Implementation . The Journal of Finance , 2000 .
Frequently asked questions
What does a horizontal channel mean?
Is a horizontal channel bullish or bearish?
How do you trade a horizontal channel?
How many touches does a horizontal channel need?
Is a horizontal channel the same as a rectangle pattern?
Practise spotting the horizontal channel
Reading about a pattern is not the same as recognising it under time pressure. Chart Guess drills 53 patterns as a 60-second game — read the chart, call BUY or SELL, get the pattern name instantly.