Double Top Pattern
A double top is a bearish reversal pattern made of two peaks at roughly the same price, separated by a meaningful pullback. It completes when price closes below the neckline drawn through the low between the two peaks.
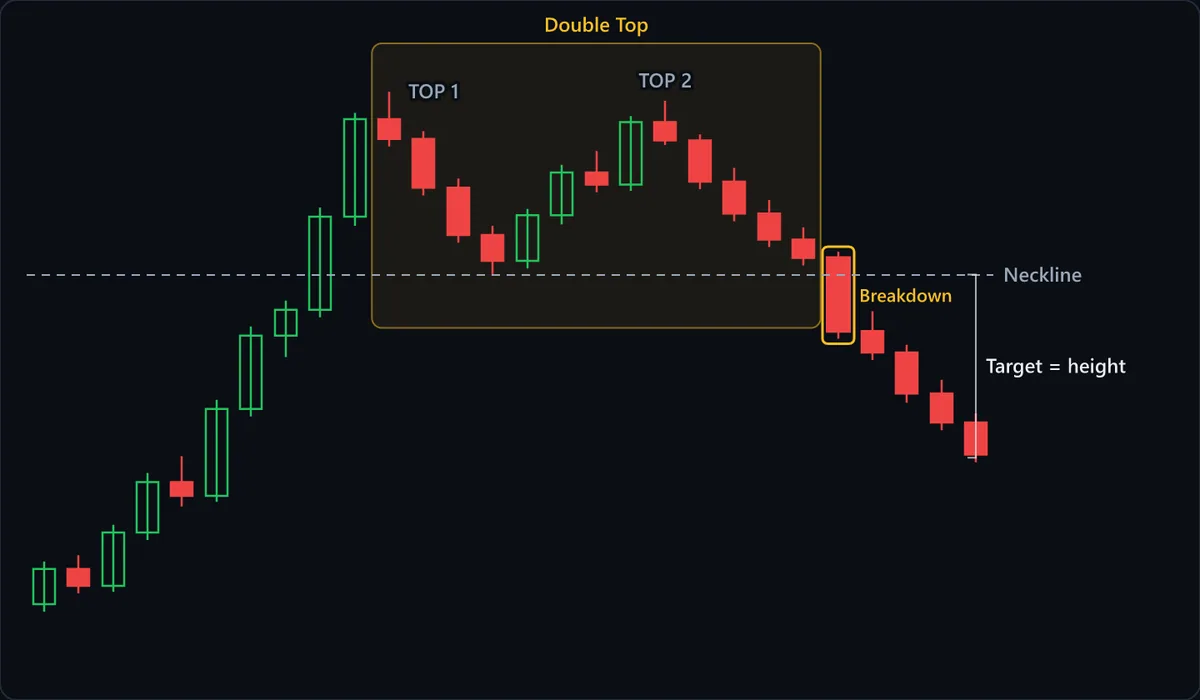
Chart data
| # | Open | High | Low | Close |
|---|---|---|---|---|
| 1 | 86.4 | 89.2 | 85.9 | 88.7 |
| 2 | 88.7 | 89.6 | 87.1 | 87.6 |
| 3 | 87.6 | 91.6 | 87.2 | 91.1 |
| 4 | 91.1 | 95 | 90.6 | 94.4 |
| 5 | 94.4 | 96.1 | 92.8 | 93.5 |
| 6 | 93.5 | 99.8 | 93.1 | 99.2 |
| 7 | 99.2 | 104.6 | 98.7 | 104 |
| 8 | 104 | 106.3 | 102.6 | 105.7 |
| 9 | 105.7 | 112.4 | 105.2 | 111.8 |
| 10 | 111.8 | 118.6 | 111.2 | 118.2 |
| 11 | 118.2 | 120 | 116.4 | 116.9 |
| 12 | 116.9 | 117.4 | 113.2 | 113.7 |
| 13 | 113.7 | 114.3 | 110.1 | 110.6 |
| 14 | 110.6 | 111.2 | 108 | 108.9 |
| 15 | 108.9 | 112.3 | 108.4 | 111.9 |
| 16 | 111.9 | 115.2 | 111.3 | 114.7 |
| 17 | 114.7 | 116.1 | 113.4 | 113.9 |
| 18 | 113.9 | 118.4 | 113.5 | 118 |
| 19 | 118 | 119.4 | 116.5 | 116.8 |
| 20 | 116.8 | 117.2 | 113.6 | 114.1 |
| 21 | 114.1 | 115 | 111.5 | 112 |
| 22 | 112 | 112.9 | 109.8 | 110.3 |
| 23 | 110.3 | 111.1 | 108.6 | 109.1 |
| 24 | 109.1 | 109.5 | 103.8 | 104.3 |
| 25 | 104.3 | 105.6 | 102.4 | 102.9 |
| 26 | 102.9 | 103.4 | 99.6 | 100.2 |
| 27 | 100.2 | 101.1 | 97.8 | 98.3 |
| 28 | 98.3 | 98.9 | 95.7 | 96.2 |
At a glance
| Type | Bearish reversal |
|---|---|
| Direction | Bearish |
| Bars required | Multiple bars |
| Family | Chart pattern |
| Evidence | Well documented |
| Also called | double top pattern, M top, M pattern |
What timeframe does it work on?
A double top needs enough bars between the two peaks for the second one to be a genuine second failed attempt at the high, not ordinary noise around a level. On daily and weekly charts the two peaks typically span weeks to months. On very short intraday timeframes, price revisits recent highs constantly, so a two-peak shape there carries far less information about an actual change in trend.
Anatomy of the pattern
- Top 1 — The first peak, formed at the end of an existing uptrend. On its own this is just a high — every uptrend makes one eventually.
- The pullback — A retracement from Top 1 down to an intervening low. This low is what becomes the neckline, so it needs to be a clear, identifiable swing rather than a shallow wobble.
- Top 2 — A second peak that approaches but fails to meaningfully exceed Top 1. This is the informative part: buyers tried again at the same level and could not extend the trend.
- The neckline — A horizontal (or near-horizontal) line through the low between the two peaks. The pattern is not complete until price closes below it — before that, it is only two peaks that happen to be similar heights.
- The measured move — The conventional target projects the vertical distance from the peaks down to the neckline, applied downward from the breakdown point.
How to identify it
- A clear prior uptrend precedes the first peak — there has to be a trend for this to reverse.
- The second peak forms at approximately the same price as the first, usually within a few percent.
- The pullback between the two peaks is a clear, meaningful decline that forms a real swing low, not a shallow dip.
- The low between the peaks can be joined to form a plausible neckline.
- Volume is often lower on the second peak than the first, though this varies enough that its absence does not rule the pattern out.
- Price closes below the neckline. Until this happens the formation is two peaks, not a completed double top.
How to trade it
Entry. The standard entry is a close below the neckline. A more conservative variant waits for price to break the neckline and then retest it from below, giving a second entry closer to the breakdown level with a tighter stop, at the cost of missing moves that never look back.
Stop. Above Top 2, or above the higher of the two peaks. A close back above the peaks means the level that capped price twice has given way, and the bearish case is gone. Tighter alternative: just above the neckline once a retest from below has held.
Target. Measure the distance from the peaks down to the neckline and project that same distance below the breakdown point. Check for prior support levels between the entry and the projected target — they frequently halt the decline before the measured move is reached.
What invalidates it
- The neckline never breaks. Two similar peaks with price holding above the intervening low is not a completed pattern, whatever it may turn into later.
- The second peak clears the first by a meaningful margin. Then the trend made a new high rather than failing, and the bearish reversal case disappears.
- There was no prior uptrend to reverse. A two-peak shape inside a long sideways range is not a double top.
- Price closes back above the neckline shortly after breaking it. Failed breakdowns from this pattern can reverse sharply, since the traders who sold the break are now trapped.
Often confused with
Double Top vs Double Bottom: what's the difference?
A double top is two highs at roughly the same price (an M), neckline through the low between them, completing on a close below that low. A double bottom is two lows (a W), neckline through the high between them, completing on a close above it. A top follows an uptrend; a bottom, a downtrend.
Double Top vs Head and Shoulders: what's the difference?
A head and shoulders has three peaks with the middle one clearly higher. A double top has exactly two peaks at comparable heights. If a third peak appears and the middle one stands clearly above the other two, it is a head and shoulders. A third peak at the same height is a triple top instead.
Double Top vs Inverse Cup and Handle: what's the difference?
A double top makes two separate peaks at a similar height with a dip between them. The inverse cup makes one continuous rounded peak, and its trigger comes after the handle, not at the dip between two highs.
Double Top vs Triple Top: what's the difference?
A double top fails at resistance twice and breaks support after a single trough; a triple top makes a third run at the same ceiling first. If price rallies back to the highs after what looked like a double top, do not short yet: the pattern is still forming.
How reliable is the double top pattern?
The double top is one of the most extensively catalogued chart patterns in the technical analysis literature, and it has been tested in both chart-pattern reference books and algorithmic studies. The reliability tier here is well-documented rather than a guarantee of a specific number, for two reasons that matter more than any quoted percentage. First, how closely the two peaks must match in height, and how deep the intervening pullback must be, are judgment calls that shift which formations qualify from one study to the next. Second, studies measure results from a confirmed breakdown, so they leave out trades taken on two similar-looking peaks before the neckline actually broke. Those early entries are a common way to get this pattern wrong. The pattern's genuine strength is the same as its bullish mirror image, the double bottom: an unambiguous completion trigger and a clearly defined invalidation level.
References
- Thomas N. Bulkowski. Encyclopedia of Chart Patterns . Wiley , 2005 . ISBN 978-0471668268.
- Robert D. Edwards, John Magee and W.H.C. Bassetti. Technical Analysis of Stock Trends . Routledge , 2018 . ISBN 978-1138069411.
- Andrew W. Lo, Harry Mamaysky and Jiang Wang. Foundations of Technical Analysis: Computational Algorithms, Statistical Inference, and Empirical Implementation . The Journal of Finance , 2000 .
Frequently asked questions
How close do the two peaks of a double top need to be?
When is a double top confirmed?
What is the difference between a double top and a head and shoulders?
How do you set a target after a double top breaks down?
Practise spotting the double top
Reading about a pattern is not the same as recognising it under time pressure. Chart Guess drills 53 patterns as a 60-second game — read the chart, call BUY or SELL, get the pattern name instantly.