Bearish Wolfe Wave Pattern
A bearish Wolfe wave is a five-point rising wedge in which the fifth wave pushes briefly above the line through points 1 and 3, fails, and reverses toward a target line drawn from point 1 through point 4.
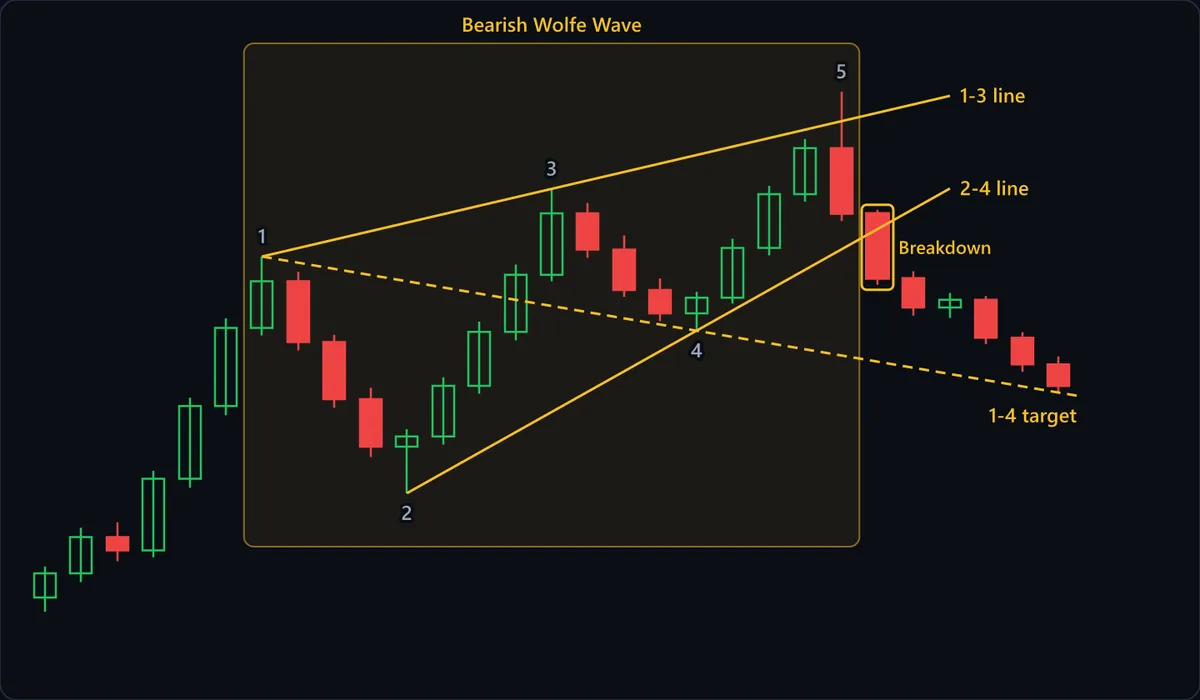
Chart data
| # | Open | High | Low | Close |
|---|---|---|---|---|
| 1 | 86.78 | 88.62 | 85.93 | 88.21 |
| 2 | 88.21 | 90.92 | 87.69 | 90.36 |
| 3 | 90.36 | 91.25 | 88.93 | 89.57 |
| 4 | 89.57 | 94.3 | 89.17 | 93.83 |
| 5 | 93.83 | 98.65 | 93.3 | 98.15 |
| 6 | 98.15 | 103.37 | 97.61 | 102.8 |
| 7 | 102.8 | 107.04 | 102.35 | 105.57 |
| 8 | 105.57 | 106.14 | 101.46 | 101.95 |
| 9 | 101.95 | 102.39 | 98.05 | 98.56 |
| 10 | 98.56 | 99.24 | 95.12 | 95.74 |
| 11 | 95.74 | 96.78 | 92.97 | 96.35 |
| 12 | 96.35 | 99.86 | 95.86 | 99.36 |
| 13 | 99.36 | 103.17 | 98.88 | 102.56 |
| 14 | 102.56 | 106.56 | 102.06 | 105.95 |
| 15 | 105.95 | 111.06 | 105.57 | 109.6 |
| 16 | 109.6 | 110.23 | 106.96 | 107.45 |
| 17 | 107.45 | 108.3 | 104.64 | 105.05 |
| 18 | 105.05 | 105.74 | 103.21 | 103.66 |
| 19 | 103.66 | 104.94 | 102.63 | 104.59 |
| 20 | 104.59 | 108.09 | 104.24 | 107.55 |
| 21 | 107.55 | 111.24 | 107.1 | 110.75 |
| 22 | 110.75 | 114.03 | 110.3 | 113.48 |
| 23 | 113.48 | 116.84 | 109.15 | 109.58 |
| 24 | 109.58 | 109.82 | 105.36 | 105.75 |
| 25 | 105.75 | 106.16 | 103.53 | 104.01 |
| 26 | 104.01 | 104.88 | 103.39 | 104.47 |
| 27 | 104.47 | 104.69 | 101.83 | 102.22 |
| 28 | 102.22 | 102.55 | 100.18 | 100.63 |
| 29 | 100.63 | 101.1 | 98.95 | 99.34 |
At a glance
| Type | Bearish reversal |
|---|---|
| Direction | Bearish |
| Bars required | Multiple bars |
| Family | Chart pattern |
| Evidence | Weak |
| Also called | bearish wolfe wave pattern, wolfe wave top, bearish wolf wave |
What timeframe does it work on?
The pattern needs five clean, roughly symmetric swings, and the lower the timeframe, the more the noise lets you pick whichever highs and lows make the lines fit. Daily and 4-hour charts on liquid stocks, indices, major forex pairs and large crypto markets give swings that are hard to fudge. On 1-minute and 5-minute charts, a one-tick spike above the 1-3 line can be mistaken for the point-5 overshoot.
Anatomy of the pattern
- Points 1 and 3 — Two rising swing highs, with 3 above 1. The line through them is the wedge's upper boundary, and its extension marks where wave 5 is expected to arrive and briefly poke through before failing. In the chart, point 3 sits clearly above point 1.
- Points 2 and 4 — Two rising swing lows, with 4 above 2. Their line, the 2-4 line, climbs more steeply than the 1-3 line, which is what makes the shape converge. Point 4 also dips below point 1, so wave 4 trades back into wave 1's territory.
- Point 5 overshoot — The final rally pierces the 1-3 line and fails. That poke is the signature: it lures breakout buyers and stops out early shorts. In the chart, the point-5 candle prints a long upper wick above the line and closes back beneath it.
- Breakdown — The marked candle closes below the 2-4 line, the wedge's rising floor. It comes one bar after point 5 and is the slower, more conservative confirmation that the reversal is under way.
- 1-4 target line — A dashed line from point 1 through point 4, projected forward. Because it slopes, the target is a moving price, not a fixed level: it sits lower the longer the decline takes to reach it.
How to identify it
- Five swings alternate cleanly: high 1, low 2, higher high 3, higher low 4, and a final high 5.
- Point 3 is above point 1, point 4 is above point 2, and the 2-4 line rises faster than the 1-3 line.
- Point 4 trades below point 1, so the two lines enclose a narrowing, upward-tilted wedge.
- Wave 5 breaks above the extended 1-3 line by a modest amount, then closes back below it.
- The swings are roughly proportional in size and time; one wave far longer than the rest usually means the points were mislabeled.
- A 1-4 line drawn and extended forward still sits below the current price, giving the trade somewhere to go.
How to trade it
Entry. Sell at point 5 once price falls back inside the wedge, typically on a close back below the 1-3 line after the overshoot. Waiting for that close skips the cases where wave 5 keeps climbing. A more conservative entry waits for a close below the 2-4 line, as the Breakdown candle in the chart shows, at the cost of a worse price.
Stop. Above the point-5 high. The whole pattern rests on that overshoot being the final, failed push; if price trades above it, buyers were not exhausted and the five-point count was wrong. The distance from entry to the point-5 high is smallest for an entry at the close back under the 1-3 line and largest for the conservative entry on the 2-4 break, so size the position to the actual distance.
Target. The extension of the 1-4 line. Read the target price off the line where price actually meets it, not where it sits today, since the line slopes down. Steep 1-4 lines imply large targets; check for prior swing lows that may halt the drop first: the point-4 low always lies between entry and target, and point 2 matters too if the projected target falls below it.
What invalidates it
- Price keeps rising after point 5 and holds above the 1-3 line. The overshoot was a real breakout, not a trap, and the stop above point 5 should be hit.
- Wave 5 never overshoots the 1-3 line. Without the failed push above it, you have an ordinary rising wedge or channel and the Wolfe wave's entry and target logic do not apply.
- The overshoot runs far beyond the 1-3 line instead of a brief poke. A large, sustained move above the boundary is momentum, not exhaustion.
- Point 4 does not trade below point 1, or the 2-4 line is not steeper than the 1-3 line. The lines no longer converge, so there is no wedge to break.
Often confused with
Bearish Wolfe Wave vs Ascending Channel: what's the difference?
In an ascending channel the upper and lower lines run roughly parallel. A bearish Wolfe wave needs the 2-4 line to climb faster than the 1-3 line, so the range narrows before point 5.
Bearish Wolfe Wave vs Bullish Wolfe Wave: what's the difference?
The mirror image: a falling wedge whose fifth wave undercuts the 1-3 line of lower lows and snaps back up. If the numbered points are descending and point 5 is a low, it is the bullish version.
Bearish Wolfe Wave vs Rising Wedge: what's the difference?
A rising wedge is traded on a break of its lower line. A bearish Wolfe wave needs one extra event first: a fifth wave that briefly breaks above the upper 1-3 line and fails. Its target also comes from the sloping 1-4 line, not the classic wedge expectation of a retrace to the wedge's starting point.
How reliable is the bearish wolfe wave pattern?
The Wolfe wave comes from practitioners, named after trader Bill Wolfe, rather than from the classic chart-pattern literature. It is absent from older classics such as Edwards and Magee, and has not had the kind of algorithmic testing applied to head and shoulders or double tops. That is why it rates weak here. The issue is not proof that it fails; it is that there is little independent evidence either way. The bigger problem is subjectivity. Five points, two converging lines and an 'overshoot' leave many choices: which swing counts as point 1, how far above the 1-3 line is a valid poke, how symmetric the waves must be. Two traders can label the same chart differently and get different targets, so no success rate is meaningful without the exact rules used. The useful part is concrete: a failed push above a rising boundary, with a hard stop at the point-5 high.
Frequently asked questions
What does a bearish Wolfe wave mean?
Is a bearish Wolfe wave bullish or bearish?
How do you trade a bearish Wolfe wave?
What happens after a bearish Wolfe wave?
How reliable is the bearish Wolfe wave?
Practise spotting the bearish wolfe wave
Reading about a pattern is not the same as recognising it under time pressure. Chart Guess drills 53 patterns as a 60-second game — read the chart, call BUY or SELL, get the pattern name instantly.