Gap Up Pattern (Rising Window)
A gap up is an upward price gap in which a candle trades entirely above the previous candle's high, leaving an empty band on the chart that no candle touches — usually because news or a wave of overnight buying repriced the market before the open.
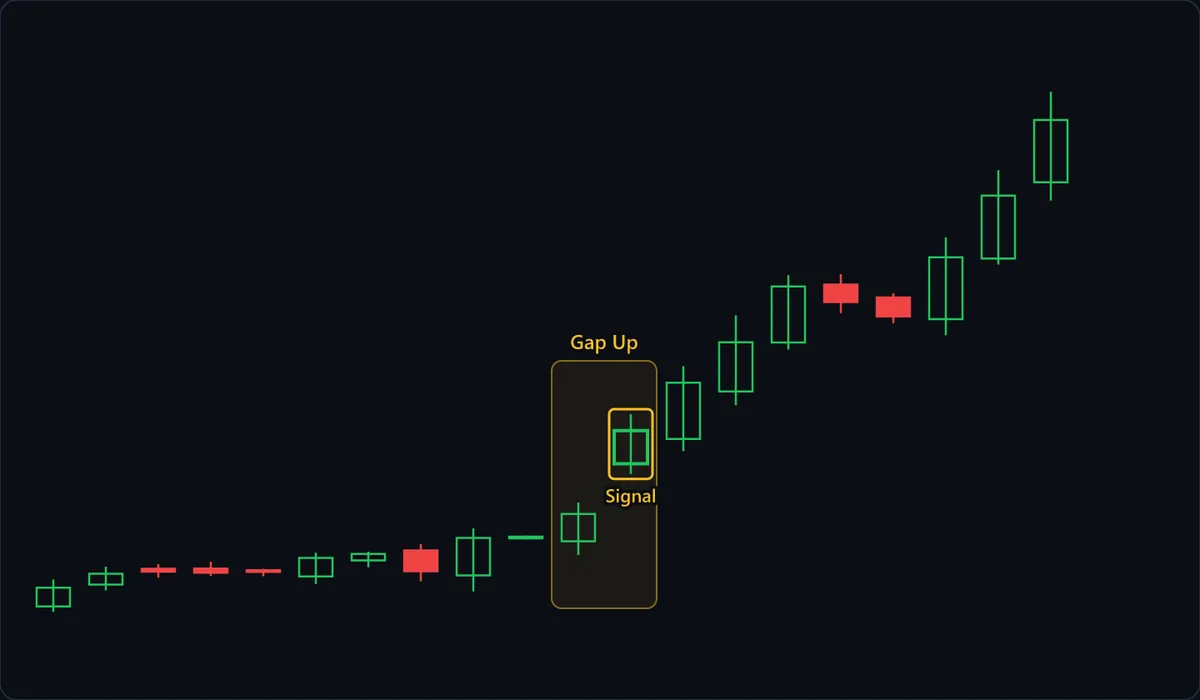
Chart data
| # | Open | High | Low | Close |
|---|---|---|---|---|
| 1 | 90.2 | 91.24 | 90 | 90.92 |
| 2 | 91.04 | 91.73 | 90.82 | 91.46 |
| 3 | 91.65 | 91.84 | 91.31 | 91.54 |
| 4 | 91.66 | 91.92 | 91.37 | 91.5 |
| 5 | 91.6 | 91.65 | 91.36 | 91.58 |
| 6 | 91.36 | 92.27 | 91.07 | 92.07 |
| 7 | 91.97 | 92.31 | 91.71 | 92.22 |
| 8 | 92.36 | 92.6 | 91.17 | 91.56 |
| 9 | 91.4 | 93.21 | 90.78 | 92.84 |
| 10 | 92.88 | 92.93 | 92.78 | 92.89 |
| 11 | 92.71 | 94.2 | 92.18 | 93.76 |
| 12 | 95.69 | 97.6 | 95.3 | 96.96 |
| 13 | 96.64 | 99.44 | 96.18 | 98.81 |
| 14 | 98.47 | 101.39 | 97.94 | 100.36 |
| 15 | 100.35 | 102.94 | 100.08 | 102.51 |
| 16 | 102.58 | 102.98 | 101.48 | 101.91 |
| 17 | 102.08 | 102.24 | 101.1 | 101.35 |
| 18 | 101.25 | 104.4 | 100.63 | 103.63 |
| 19 | 103.58 | 106.98 | 103.35 | 106 |
| 20 | 106.51 | 110 | 105.81 | 108.91 |
At a glance
| Type | Continuation |
|---|---|
| Direction | With the trend |
| Bars required | 2 candles |
| Family | Chart pattern |
| Evidence | Context dependent |
| Also called | gap up pattern, bullish gap, rising window, upside gap |
What timeframe does it work on?
Real gaps form across a pause in trading, so they live on daily and weekly stock and index charts, where news lands while the market is shut; intraday, the meaningful gap is the session's first bar. Forex mostly gaps at the weekly open, round-the-clock crypto barely gaps at all, and tiny gaps between one-minute bars in thin markets are liquidity holes, not patterns.
Anatomy of the pattern
- The quiet base — Small, overlapping candles drift gently higher before the jump. A gap out of a quiet range like this is a breakaway candidate; the same jump at the end of a long, steep advance is where exhaustion gaps form.
- The empty space — Inside the Gap Up highlight, no candle covers the band between the last base candle's high and the Signal candle's low. Shorts from below are underwater with no prices in between to exit at, and buyers who missed the jump wait to buy any dip toward it — the pressure behind a gap that holds.
- The Signal candle — The gap candle. Its low is the floor of the repricing and anchors the stop; its high is the breakout trigger. Its volume is the most important reading on a gap — this chart shows none, so check yours.
- The candles after the gap — They classify it. The next candle holds above the Signal low and clears the Signal high — breakaway behavior, and the only entry this chart offers, because the later two-candle pullback stops far above the gap. A slide back into the empty space within a session or two would have marked it a failed breakaway, closer to a common gap; after a long, steep run the same quick fill is the sign of an exhaustion gap.
How to identify it
- The gap candle's low sits above the previous candle's high, with no overlap at all. An open above the prior close that trades back into the prior range during the session leaves no gap on the chart.
- The jump is large next to the candles before it; a sliver of a gap inside a sideways range is a common gap, which tends to fill and says little.
- You can name its starting point: a flat or gently rising base (breakaway candidate), the middle of an established advance (runaway), or the end of a long, steep run (exhaustion candidate).
- Volume on the gap candle clearly exceeds the base's typical volume; on ordinary volume it is more likely a common gap.
- The first few sessions hold above the gap candle's low. Breakaway and runaway gaps usually hold; exhaustion gaps tend to fill fast.
How to trade it
Entry. Never the opening print — the opening minutes of a gap session swing hardest and reveal nothing about whether the gap will hold. Buy a pullback that dips into the upper part of the gap and holds, closing back above the gap candle's low, or a break above the gap candle's high, which shows buyers followed through. The first gets a better price; the second pays up for proof.
Stop. Below the gap candle's low, judged on a close. That low is the floor of the repricing; a close beneath it means price is settling back into the empty space instead of defending it. The breakout entry puts the gap candle's whole range between entry and stop, so size the position to that distance rather than tightening the stop.
Target. Add the height of the base the gap left behind to the base's top — the measured move — unless the next resistance, such as a prior swing high, sits closer. A runaway gap in mid-trend has no base of its own, but the classic references call it a measuring gap: it tends to form near the halfway point, so project the distance from the start of the advance to the gap upward from the gap, and stop sooner if the next resistance is closer.
What invalidates it
- A close below the gap candle's low. Price is back inside the empty space, and gaps that fill often reverse the move that made them.
- The gap candle sells off from the open and closes near its low. Even with the gap still open, sellers were waiting at the new prices, which is how news that was already priced in tends to look.
- It follows a long, steep advance rather than a base. That is exhaustion territory, the last buyers paying up at once, and the gap is a warning about the trend, not an invitation to join it.
Often confused with
Gap Up vs Bullish Kicker: what's the difference?
A bullish kicker is a gap up with strict shapes: a long red candle with almost no wicks, then a long green one opening above the red candle's open. A plain gap up needs only empty space above the prior high, whatever the candles look like.
Gap Up vs Gap Down: what's the difference?
Mirror images. A gap up trades entirely above the previous candle's high and leaves the empty space beneath price as a floor; a gap down trades entirely below the previous candle's low and leaves it overhead as a ceiling. Each fails when a close crosses back into its gap.
Gap Up vs Island Reversal: what's the difference?
An island reversal is two gaps in opposite directions with candles stranded between them; a gap up is one gap. An island top begins with a gap up and an island bottom ends with one, so look for an opposing gap on either side.
How reliable is the gap up pattern?
Its reliability depends on context. Edwards and Magee and Murphy sort gaps into common, breakaway, runaway and exhaustion types, and Nison treats the same event, the rising window, as a continuation signal. Those types point in opposite directions — breakaway and runaway gaps start or extend a move, an exhaustion gap ends one — and the gap candle itself can look the same in each case. Location gives the first read and the following sessions confirm it, which is why both entries on this page wait. In the pattern's favor, its existence and its failure are both objective: a band of prices either went untraded on the chart or it did not, and price either closes back into it or it does not.
References
- Robert D. Edwards, John Magee and W.H.C. Bassetti. Technical Analysis of Stock Trends . Routledge , 2018 . ISBN 978-1138069411.
- John J. Murphy. Technical Analysis of the Financial Markets . New York Institute of Finance , 1999 . ISBN 978-0735200661.
- Steve Nison. Japanese Candlestick Charting Techniques . Prentice Hall Press , 2001 . ISBN 978-0735201811.
Frequently asked questions
What does a gap up mean?
Is a gap up bullish or bearish?
How do you trade a gap up?
Do gap ups always get filled?
Practise spotting the gap up
Reading about a pattern is not the same as recognising it under time pressure. Chart Guess drills 53 patterns as a 60-second game — read the chart, call BUY or SELL, get the pattern name instantly.