Bullish Kicker Candlestick Pattern
A bullish kicker is a two-candle reversal in which a long red candle with almost no wicks is followed by a long green candle that opens above the red candle's open and closes at its high, leaving a gap between the two bodies that stays unfilled.
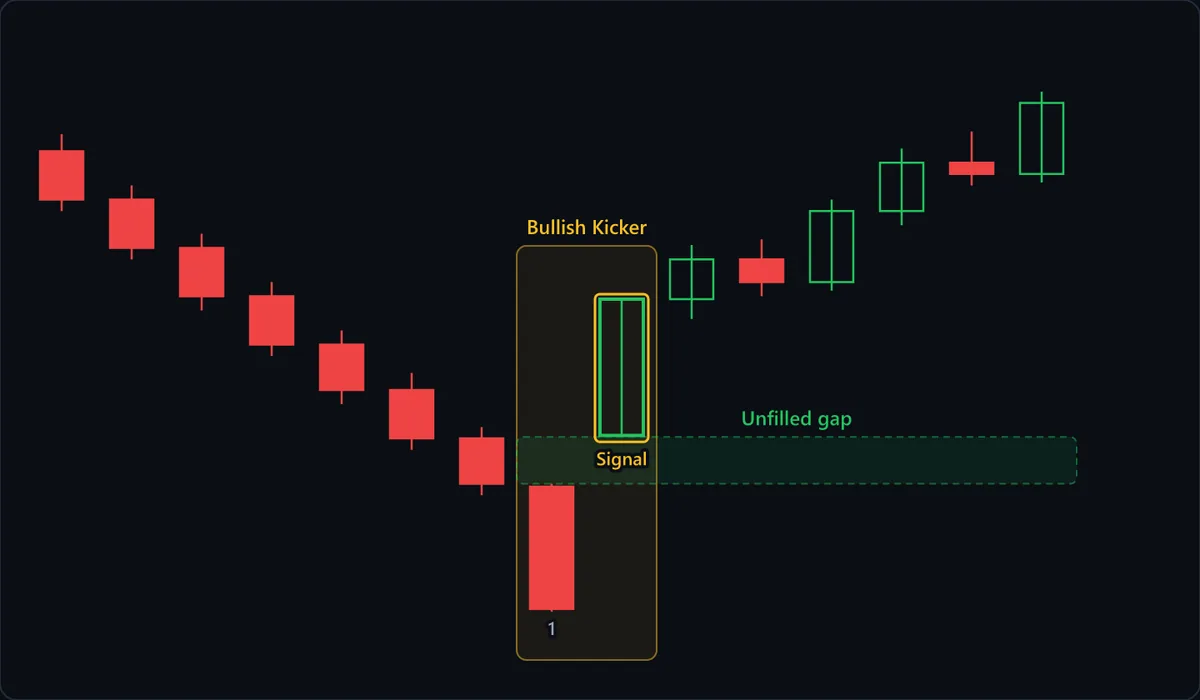
Chart data
| # | Open | High | Low | Close |
|---|---|---|---|---|
| 1 | 118 | 118.6 | 115.9 | 116.3 |
| 2 | 116.3 | 116.8 | 114.2 | 114.6 |
| 3 | 114.6 | 115.1 | 112.4 | 112.9 |
| 4 | 112.9 | 113.4 | 110.8 | 111.2 |
| 5 | 111.2 | 111.7 | 109.1 | 109.6 |
| 6 | 109.6 | 110.2 | 107.5 | 107.9 |
| 7 | 107.9 | 108.3 | 105.9 | 106.3 |
| 8 | 106.2 | 106.3 | 101.8 | 101.9 |
| 9 | 108 | 112.8 | 107.95 | 112.8 |
| 10 | 112.8 | 114.7 | 112.1 | 114.2 |
| 11 | 114.2 | 114.9 | 112.9 | 113.4 |
| 12 | 113.4 | 116.3 | 113.1 | 115.9 |
| 13 | 115.9 | 118.1 | 115.4 | 117.6 |
| 14 | 117.6 | 118.7 | 116.8 | 117.2 |
| 15 | 117.2 | 120.1 | 116.9 | 119.7 |
At a glance
| Type | Bullish reversal |
|---|---|
| Direction | Bullish |
| Bars required | 2 candles |
| Family | Candlestick pattern |
| Evidence | Moderate |
| Also called | bullish kicker candlestick, bullish kicking pattern, kicking bullish |
What timeframe does it work on?
A kicker needs the second candle to open well away from the first candle's close, which only happens across a break in trading. That makes it a daily and weekly pattern on stocks and indices, where earnings or overnight news reprice the open. Forex can print one at the weekly open; continuous crypto markets almost never can, because each candle opens where the last one closed. A kicker on a one-minute chart of a thin market is usually a liquidity hole, not a change of mind.
Anatomy of the pattern
- Candle 1 — A bearish marubozu: in the chart it opens at 106.20, closes at 101.90 and has only a few cents of wick at either end. Sellers controlled the session from first trade to last, and it is the biggest red body of the decline.
- The kick — The Signal candle opens at 108.00, above candle 1's open of 106.20. Every price candle 1 traded at is skipped. Everyone who sold short during that red session is underwater from the first print, with no prices in between to cover at.
- Signal — A bullish marubozu that closes at its high of 112.80. A lower wick of only a few cents (low 107.95 against the 108.00 open) means sellers barely pushed price back toward the gap; no upper wick means buyers were still paying the highest price of the session at the close.
- Unfilled gap — The band from candle 1's high at 106.30 to the Signal low at 107.95. It stays empty for every candle that follows. Its lower edge is the line the pattern's invalidation is measured against.
How to identify it
- Candle 1 is red with a long body and wicks so small they are barely visible: it opens near its high and closes near its low.
- The second candle opens above candle 1's open, not merely above its close. Bodies that touch or overlap mean something weaker: an open level with candle 1's open has the shape of separating lines, a weaker continuation pattern, and an open inside candle 1's body is a bounce, not a kick.
- The second candle is green, long next to the candles before it, and closes at or very near its high with little or no wick at either end.
- Space separates the two bodies. Stricter rulesets also require the second candle's low to sit above candle 1's high, a true gap like the one in the chart.
- The chart is one where gaps are possible: a daily or weekly stock or index chart, or a session open, not a 24-hour market.
How to trade it
Entry. Buy on the close of the Signal candle, or on a shallow dip that holds above the gap. Kickers often give no meaningful dip at all: in the chart the next candle only slipped to 112.10. That is why a common approach takes a partial position at the close and adds only if a dip arrives and holds above the gap.
Stop. The tight version goes below the Signal candle's midpoint, 110.40 in the chart: giving back half of a session that closed at its high says the conviction has faded. The wide version goes below the gap, under candle 1's high at 106.30, the level whose loss breaks the pattern outright. The wide stop needs a smaller position.
Target. The pattern projects no distance. Aim for the next resistance, such as the level where the decline the kick interrupted began, near 118 in the chart. Because a kick can mark the start of a new advance rather than a bounce, trail the stop under each new higher low instead of exiting everything at the first target.
What invalidates it
- A close back inside candle 1's range. The gap was the whole statement; once price trades back into the red session's prices, the one-session change of mind did not stick.
- The Signal candle closes well off its high with a long upper wick. That is a gap up that met sellers, not a kick.
- The second candle opens at or below candle 1's open. An open inside the red body is a bounce, not a kick; an open at or below candle 1's close puts the setup in the engulfing or piercing family, to be judged by their rules.
- Candle 1 is small or has long wicks. Without a full session of one-sided selling there is no sharp reversal of control for the second candle to show.
Often confused with
Bullish Kicker vs Bearish Kicker: what's the difference?
Mirror images. A bullish kicker is a red marubozu followed by a gap above its open into a green marubozu; a bearish kicker is a green marubozu followed by a gap below its open into a red one. Check which way the gap jumps and the color of the second candle.
Bullish Kicker vs Bullish Engulfing: what's the difference?
A bullish engulfing's second candle opens at or below the red candle's close and its body covers the red body. A kicker's second candle opens above the red candle's open, so the bodies never overlap. If you can see the green body wrapping the red one, it is engulfing.
Bullish Kicker vs Gap Up: what's the difference?
A bullish kicker is a gap up with strict shapes: a long red candle with almost no wicks, then a long green one opening above the red candle's open. A plain gap up needs only empty space above the prior high, whatever the candles look like.
How reliable is the bullish kicker pattern?
Moderate, for two reasons. The case for it is the definition: two full sessions controlled by opposite sides, separated by prices nobody traded, is about as forceful a statement as two candles can make, which is why the kicker is often described as one of the most forceful candlestick signals and as leaning less on the prior trend than most. The case against a higher tier is evidence. Strict kickers are rare, since they need two near-wickless candles and a gap, so any study rests on few examples, and rulesets disagree about how small a wick must be and whether the gap must clear the shadows or only the bodies. A kicker is also usually the footprint of news, and the candles cannot tell you whether more news is coming.
References
- Thomas N. Bulkowski. Encyclopedia of Candlestick Charts . Wiley , 2008 . ISBN 978-0470182017.
Frequently asked questions
What does a bullish kicker mean?
Is a bullish kicker bullish or bearish?
How do you trade a bullish kicker?
Does a bullish kicker need a downtrend?
Why are bullish kickers so rare?
Practise spotting the bullish kicker
Reading about a pattern is not the same as recognising it under time pressure. Chart Guess drills 53 patterns as a 60-second game — read the chart, call BUY or SELL, get the pattern name instantly.