Morning Star Candlestick Pattern
A morning star is a three-candle bullish reversal pattern: a long bearish candle, followed by a small-bodied candle that gaps lower, followed by a long bullish candle that closes well back up into the first candle's body.
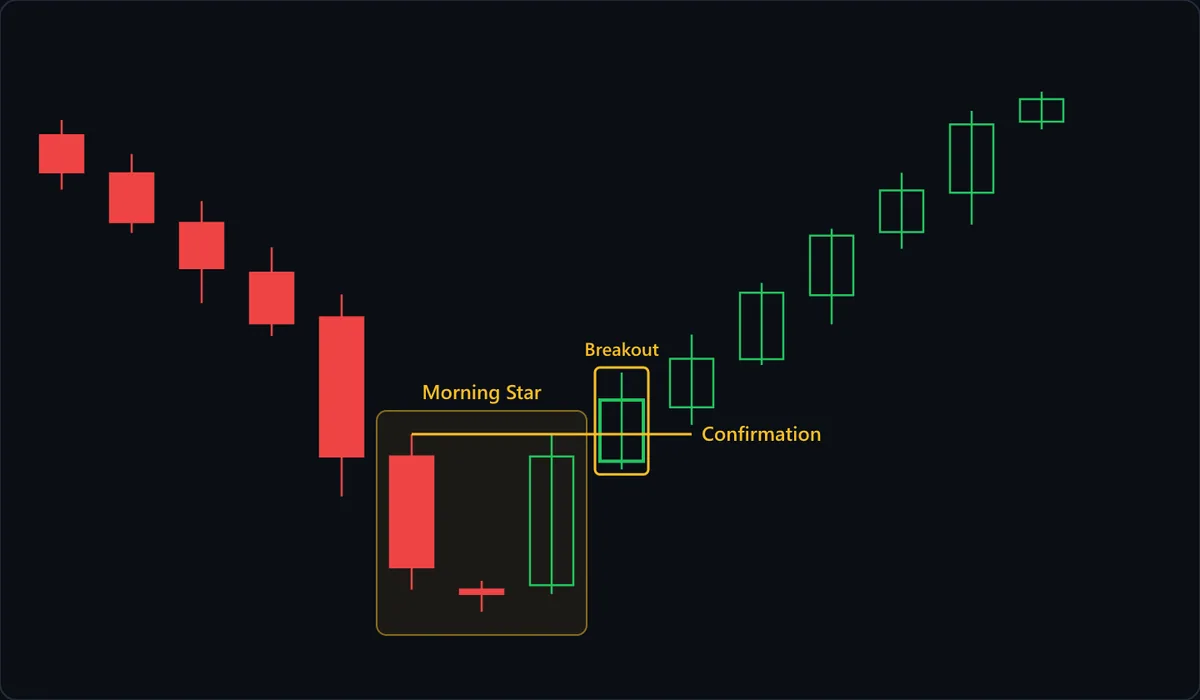
Chart data
| # | Open | High | Low | Close |
|---|---|---|---|---|
| 1 | 108.32 | 108.91 | 106.23 | 106.9 |
| 2 | 106.86 | 107.6 | 104.57 | 104.98 |
| 3 | 104.95 | 105.79 | 101.87 | 103.21 |
| 4 | 103.04 | 104.01 | 100.61 | 101.09 |
| 5 | 101.32 | 102.2 | 94.43 | 95.97 |
| 6 | 95.97 | 96.83 | 90.85 | 91.71 |
| 7 | 90.85 | 91.19 | 90 | 90.68 |
| 8 | 91.02 | 96.83 | 90.68 | 95.97 |
| 9 | 95.79 | 99.2 | 95.47 | 98.14 |
| 10 | 97.86 | 100.66 | 97.19 | 99.73 |
| 11 | 99.71 | 102.64 | 99.49 | 102.27 |
| 12 | 102.17 | 104.73 | 101.05 | 104.46 |
| 13 | 104.6 | 106.88 | 103.96 | 106.2 |
| 14 | 106.11 | 109.26 | 104.89 | 108.74 |
| 15 | 108.84 | 110 | 108.55 | 109.71 |
At a glance
| Type | Bullish reversal |
|---|---|
| Direction | Bullish |
| Bars required | 3 candles |
| Family | Candlestick pattern |
| Evidence | Moderate |
| Also called | morning star candlestick, morning star pattern |
What timeframe does it work on?
Because it spans three full candles, a morning star carries more information than a single-candle signal like a hammer, but it also needs a genuine prior downtrend to reverse. On lower timeframes the small middle candle is more prone to being an arbitrary pause rather than real indecision, so the pattern reads with more confidence on daily charts than on short intraday ones. True gaps are also rarer on markets that trade continuously, such as forex or crypto.
Anatomy of the pattern
- First candle: long bearish — A full-bodied down candle in the direction of the prevailing downtrend. It represents the selling pressure the pattern is about to reverse.
- Second candle: the star — A small-bodied candle, ideally gapping below the first candle's close. Its small size reflects indecision — the decline has stalled, even though nothing has reversed yet.
- Third candle: long bullish — A full-bodied up candle that closes well into the first candle's body — the deeper the close, the stronger the reversal reads. It should close at least halfway up the first candle's real body; a close that only barely clears the star does not qualify.
- The confirmation level — Often marked at the first candle's high. A close above it, whether by the third candle or, as in the chart, the candle that follows, confirms the reversal; a third candle that closes at or above the first candle's open has already erased that candle's decline.
How to identify it
- The first candle is a long-bodied bearish candle, continuing an existing downtrend.
- The second candle has a small body and ideally gaps below the first candle's close.
- The third candle is a long-bodied bullish candle that closes at least halfway up the first candle's real body.
- The deeper the third candle closes into the first candle's body, the stronger the signal is generally read to be.
- A genuine downtrend precedes the three-candle sequence — the same shape mid-range carries much less meaning.
- Rising volume on the third candle strengthens the signal.
How to trade it
Entry. Most approaches wait for the third candle to close, since that close completes the pattern; entering during the second candle anticipates a reversal that has not happened. An alternative is to wait for a pullback toward the middle candle after the pattern completes, which tightens the distance to the stop. Another variation waits one more candle for a close above the first candle's high, trading a later entry for extra confirmation.
Stop. Below the low of the pattern, which is usually the second candle's low (the star). That low represents the point of maximum pessimism during the sequence; a close back beneath it means the reversal did not hold.
Target. A first objective is the open of the first (bearish) candle, where the pattern has fully recovered that candle's decline; beyond that, use the prior swing high or nearby resistance. A morning star says the decline has likely stalled, not how far the recovery will run.
What invalidates it
- There was no prior downtrend. A three-candle sequence that happens to look like a morning star in the middle of a range is not a reversal signal.
- The second candle's body is not meaningfully smaller than the first and third. Three similarly sized candles do not show the pause in selling that defines this pattern.
- The third candle closes below the midpoint of the first candle's real body. Without recovering at least half of that decline, the sequence is not a morning star.
- Price closes back below the second candle's low shortly after the pattern completes. The reversal the sequence advertised did not hold.
Often confused with
Morning Star vs Hammer: what's the difference?
A hammer is one candle with a long lower wick; a morning star is a three-candle sequence, one candle per period. The star itself can be hammer-shaped. What makes it a morning star is the long bearish candle before it and the long bullish candle after it closing at least halfway up the first body.
Morning Star vs Piercing Line: what's the difference?
A morning star takes three candles, with a small-bodied star between the red candle and the green one. A piercing line has no pause in between: the green candle answers the red candle directly on the very next bar.
Morning Star vs Three Inside Up: what's the difference?
Both are three-candle bottoms with a small middle candle. A morning star's middle candle sits below the red close, often gapped, and its third candle need only close past the red midpoint. A three inside up's middle body sits inside the red body, and candle 3 must close above the red open.
Morning Star vs Three Outside Up: what's the difference?
Both are three-candle bottoms, but the big candles sit in different places. A morning star runs long red, small stalled middle, long green recovery; a three outside up runs small red, large green engulfing, then a third green candle that only has to close higher.
How reliable is the morning star pattern?
The morning star is a long-established pattern in the candlestick literature. Because it needs three candles to line up, a morning star asks more of price than a single-candle signal like the hammer: the selling has to stall, then reverse, in sequence. Definitions vary on how strictly the gap and the depth of the third candle's close are required. A loose version, where the star simply has a small body with no true gap, shows up far more often than the textbook form, so it is worth knowing which definition a source is using. The star's location matters: a star that forms right at a prior support level or swing low gives the sequence more to work with than one that appears in open space.
References
- Steve Nison. Japanese Candlestick Charting Techniques . Prentice Hall Press , 2001 . ISBN 978-0735201811.
- Thomas N. Bulkowski. Encyclopedia of Candlestick Charts . Wiley , 2008 . ISBN 978-0470182017.
Frequently asked questions
Does the middle candle of a morning star have to gap down?
How far does the third candle need to close into the first candle's body?
What is the difference between a morning star and a hammer?
Is a morning star reliable on its own?
Practise spotting the morning star
Reading about a pattern is not the same as recognising it under time pressure. Chart Guess drills 53 patterns as a 60-second game — read the chart, call BUY or SELL, get the pattern name instantly.