Piercing Line Candlestick Pattern
A piercing line is a two-candle bullish reversal in a downtrend: a long red candle is followed by a green candle that opens below the red candle's low and closes above the midpoint of its body but below its open.
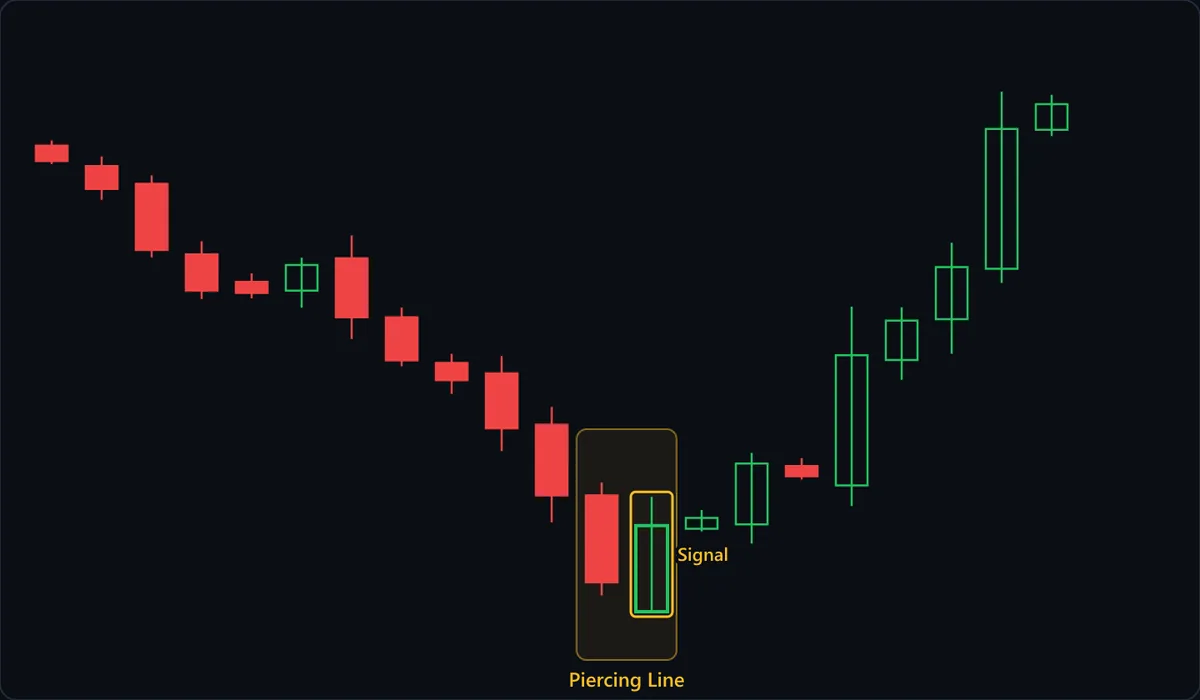
Chart data
| # | Open | High | Low | Close |
|---|---|---|---|---|
| 1 | 107.92 | 108.12 | 107.21 | 107.33 |
| 2 | 107.14 | 107.51 | 105.84 | 106.26 |
| 3 | 106.46 | 106.78 | 103.62 | 103.91 |
| 4 | 103.74 | 104.25 | 102.03 | 102.35 |
| 5 | 102.68 | 103.01 | 102.05 | 102.26 |
| 6 | 102.35 | 103.61 | 101.69 | 103.33 |
| 7 | 103.59 | 104.47 | 100.49 | 101.32 |
| 8 | 101.32 | 101.7 | 99.44 | 99.66 |
| 9 | 99.57 | 99.92 | 98.38 | 98.9 |
| 10 | 99.17 | 99.83 | 96.18 | 97.05 |
| 11 | 97.19 | 97.88 | 93.44 | 94.47 |
| 12 | 94.47 | 94.97 | 90.63 | 91.13 |
| 13 | 90 | 94.42 | 90 | 93.31 |
| 14 | 93.19 | 93.91 | 93.09 | 93.61 |
| 15 | 93.36 | 96.11 | 92.62 | 95.7 |
| 16 | 95.6 | 95.91 | 95.08 | 95.21 |
| 17 | 94.86 | 101.73 | 94.06 | 99.86 |
| 18 | 99.68 | 101.71 | 98.92 | 101.19 |
| 19 | 101.25 | 104.19 | 99.92 | 103.25 |
| 20 | 103.19 | 110 | 102.64 | 108.56 |
| 21 | 108.53 | 109.88 | 108.29 | 109.52 |
At a glance
| Type | Bullish reversal |
|---|---|
| Direction | Bullish |
| Bars required | 2 candles |
| Family | Candlestick pattern |
| Evidence | Moderate |
| Also called | piercing pattern, piercing line candlestick, bullish piercing pattern |
What timeframe does it work on?
The pattern depends on the second candle opening below the first candle's low, which needs a break between sessions. That makes daily stock and index charts its natural home, and the first bar of an intraday stock session can qualify too. On round-the-clock forex and crypto charts each candle usually opens at the prior close, so the strict version barely occurs there and most charting tools quietly relax the rule.
Anatomy of the pattern
- Long red first candle — A full-bodied bearish candle extending the decline, the left bar in the highlighted box. A long red body shows sellers firmly in control, which is what makes the next session's recovery meaningful.
- Open below the prior low — The green Signal candle opens beneath the red candle's low. Sellers get exactly the continuation they wanted at the open, which is the bait in the pattern: everyone short is comfortable for a moment.
- Close above the red midpoint — The Signal candle rallies through the session and closes above the halfway point of the red body. Reclaiming more than half of the prior session's losses is the line between a piercing line and the much weaker thrusting line.
- Close below the red open — The green close stops short of the red candle's open, as it does in the chart, where the Signal candle's high barely reaches that level. A close above the open would cover the whole red body and make it a bullish engulfing instead.
- Follow-through bar — The candle after the pattern is not part of the definition, but it tests the read. In the chart it holds inside the Signal candle's range instead of breaking its low.
How to identify it
- Price has been falling for several candles; the pattern is a reversal and needs something to reverse.
- The first candle is red with a long body relative to the recent candles, not a small or doji-like bar.
- The second candle opens below the first candle's low, not merely below its close.
- The second candle closes above the midpoint of the first candle's body, measured from open to close and ignoring the wicks.
- The second candle closes below the first candle's open; if it closes above, you are looking at a bullish engulfing.
- The pair forms at or near a level that already mattered, such as a prior swing low or a support zone.
How to trade it
Entry. The app's approach is to buy on the close of the green candle, since that close is the completed signal, or to wait for a pullback toward the red candle's midpoint. The retest entry gets a better price and tests whether buyers defend the level they just reclaimed, but strong piercing lines often never come back to offer it.
Stop. Below the green candle's low. That low is where the gap down ran out of sellers, so trading back beneath it undoes the whole session of buying. Because the green candle opens near its low, an entry on its close puts the stop roughly a full body-length away (plus any lower wick), and position size should shrink to match; the midpoint-retest entry shortens that distance.
Target. The first target is the red candle's open, the top of the body the pattern only partly recovered and the natural spot for trapped sellers to exit. Beyond that, aim for the prior swing high that started the leg down. The pattern measures nothing on its own, so both targets come from the structure around it.
What invalidates it
- A close below the green candle's low. The reversal session has been fully erased and sellers own the low again.
- The green candle closes at or below the red body's midpoint. That is a thrusting line or an in-neck line, which the canon treats as more likely to see the decline continue.
- There was no real decline before the pair. A red candle and a partial green recovery in the middle of a range is ordinary noise, not a reversal.
- The second candle opened at or above the first candle's low. Without the gap below the prior low there are no trapped sellers, and the pair is just a green bar recovering part of a red one.
- In a steep, accelerating decline, a green close just past the red midpoint is often only a pause; without support underneath, treat it as a bounce until the next candle closes above the green candle's close.
Often confused with
Piercing Line vs Bullish Engulfing: what's the difference?
Look at where the green candle closes relative to the red candle's open. Below the open but above the midpoint is a piercing line; at or above the open, so the green body covers the entire red body, is a bullish engulfing.
Piercing Line vs Dark Cloud Cover: what's the difference?
Dark cloud cover is the mirror image at a top: after an advance, a green candle is followed by a red one that opens above its high and closes below the midpoint of the green body. Same midpoint logic, opposite trend and colors.
Piercing Line vs Morning Star: what's the difference?
A morning star takes three candles, with a small-bodied star between the red candle and the green one. A piercing line has no pause in between: the green candle answers the red candle directly on the very next bar.
Piercing Line vs Tweezer Bottom: what's the difference?
A classic piercing line has the green candle open below the red candle's low, so its own low sits beneath the first one, and close past the red body's midpoint. A tweezer bottom ignores the open and requires the two lows to line up instead.
How reliable is the piercing line pattern?
The piercing line is a standard part of the classic candlestick canon, paired with its bearish mirror, dark cloud cover, and the major references treat it as a genuine reversal signal that is weaker than a bullish engulfing because buyers recover only part of the prior body. It sits in the moderate tier because its results depend on rule choices that vary between sources: whether the second open must clear the first candle's low or only its close, whether the midpoint is a hard threshold, and how much prior decline counts. In markets without session gaps the strict definition hardly appears, so anything said about it on forex or crypto charts describes a looser pattern.
References
- Steve Nison. Japanese Candlestick Charting Techniques . Prentice Hall Press , 2001 . ISBN 978-0735201811.
- Thomas N. Bulkowski. Encyclopedia of Candlestick Charts . Wiley , 2008 . ISBN 978-0470182017.
Frequently asked questions
What does a piercing line mean?
Is a piercing line bullish or bearish?
What is the difference between a piercing line and a thrusting line?
Can a piercing line form in forex or crypto?
Does a piercing line need confirmation?
Practise spotting the piercing line
Reading about a pattern is not the same as recognising it under time pressure. Chart Guess drills 53 patterns as a 60-second game — read the chart, call BUY or SELL, get the pattern name instantly.