Tweezer Bottom Candlestick Pattern
A tweezer bottom is a two-candle bullish reversal signal that forms after a decline when a red candle and the green candle after it bottom out at the same or nearly the same price, showing that sellers were stopped at one level twice in a row.
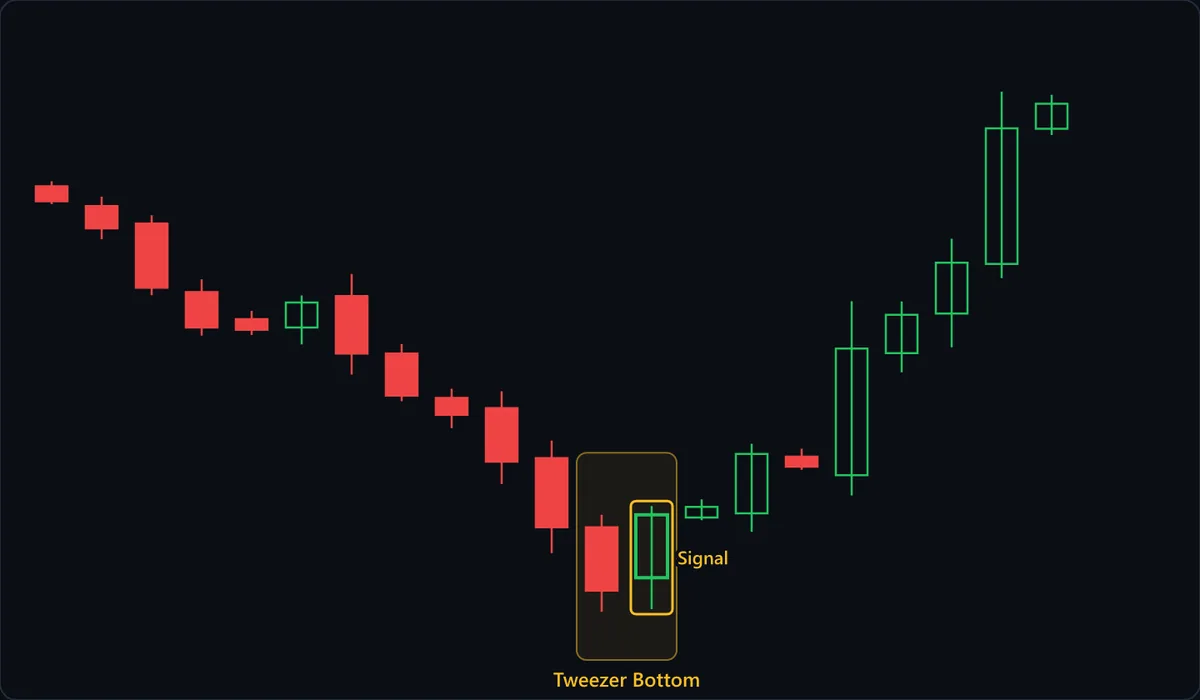
Chart data
| # | Open | High | Low | Close |
|---|---|---|---|---|
| 1 | 106.36 | 106.55 | 105.67 | 105.78 |
| 2 | 105.6 | 105.96 | 104.33 | 104.74 |
| 3 | 104.93 | 105.25 | 102.17 | 102.46 |
| 4 | 102.29 | 102.78 | 100.62 | 100.93 |
| 5 | 101.25 | 101.57 | 100.64 | 100.84 |
| 6 | 100.93 | 102.16 | 100.28 | 101.89 |
| 7 | 102.14 | 102.99 | 99.12 | 99.93 |
| 8 | 99.93 | 100.3 | 98.09 | 98.31 |
| 9 | 98.22 | 98.57 | 97.06 | 97.57 |
| 10 | 97.83 | 98.48 | 94.91 | 95.77 |
| 11 | 95.91 | 96.58 | 92.25 | 93.25 |
| 12 | 93.25 | 93.73 | 90 | 90.81 |
| 13 | 91.31 | 94.06 | 90.1 | 93.73 |
| 14 | 93.62 | 94.32 | 93.52 | 94.03 |
| 15 | 93.78 | 96.46 | 93.07 | 96.07 |
| 16 | 95.96 | 96.27 | 95.46 | 95.58 |
| 17 | 95.25 | 101.94 | 94.47 | 100.12 |
| 18 | 99.94 | 101.93 | 99.21 | 101.42 |
| 19 | 101.47 | 104.34 | 100.17 | 103.42 |
| 20 | 103.37 | 110 | 102.83 | 108.59 |
| 21 | 108.57 | 109.88 | 108.33 | 109.53 |
At a glance
| Type | Bullish reversal |
|---|---|
| Direction | Bullish |
| Bars required | 2 candles |
| Family | Candlestick pattern |
| Evidence | Context dependent |
| Also called | tweezer bottom candlestick, tweezer bottom pattern, tweezer bottoms |
What timeframe does it work on?
Intraday charts produce tweezer bottoms all day, and they earn attention mainly when the shared low lands on a level traders already watch, such as the prior session's low, the overnight low or a round number. On one-minute charts, equal lows are often an accident of tick size and mean little. On a daily chart the pattern means two full sessions could not break one price, which is a stronger statement but places the stop further from the entry.
Anatomy of the pattern
- Two-leg decline — The tweezer needs a selloff to reverse. In the chart, price slides, pauses briefly around a lone green candle, then falls in a steeper second leg that ends with two long red candles. The two boxed candles stop that acceleration.
- First candle: the flush — A long red candle prints a fresh low for the move and closes near it. Sellers look fully in charge, which is why the next candle's failure to go lower matters.
- Matching lows — The two lows sit at, or within a few ticks of, one price. In the chart the Signal candle's low stops a fraction above the red candle's low, a gap that is tiny next to either candle's range.
- Signal candle — The green candle opens slightly above the red close, probes down to the shared low, then rallies to close near its high and above the red candle's open. It recovers the whole of the previous session, which turns a coincidence of lows into evidence of buying.
- Confirmation close — The trigger is a later close above the Signal candle's high. In the chart the first candle after the Signal pokes above that high but closes only level with it, not clearly above; the following candle closes clearly above, and that is the entry.
How to identify it
- A run of falling candles leads into the pair, or price is dropping into a support level that has turned it before.
- Two adjacent candles share a low, either exactly or with a difference that is small compared with the candles' ranges. A third candle holding the same low still counts.
- The classic order is red then green. Two green candles with equal lows also qualify; two red candles closing weak at the same low show no buying yet and say much less.
- Stronger when the second candle closes in the upper part of its range, showing the retest of the low was bought rather than merely paused.
- Extra weight if the second candle is itself a hammer or a bullish engulfing, because then two separate signals agree at one price.
- The shared low is not just the latest touch of a floor that a sideways range has been bouncing off for many bars.
How to trade it
Entry. Buy on a close above the high of the second candle. The matching lows only prove that selling stopped at a price; a close above the Signal candle's high shows buyers carrying price beyond the reversal session, and it filters out tweezers that only pause a decline. In the chart that close arrives two candles after the Signal, not one.
Stop. Just below the matching lows, measured from the lower of the two when they differ. That shared low is the level the pattern says buyers are defending, so a close beneath it removes the reason for the trade. If that stop is too far away, trade smaller rather than moving it up into the candles' bodies.
Target. The nearest resistance overhead, or the start of the last decline. A tweezer bottom marks where a leg down ran out, so the natural objective is where that leg began. In the chart, the second leg started at the top of the large red candle after the pause; nearer resistance is the more conservative first exit.
What invalidates it
- A candle closes below the tweezer lows. The floor the pattern was built on has broken, and the decline is resuming.
- The equal lows sit inside sideways chop. Matching lows at the bottom of a range are the range behaving normally, not a downtrend reversing.
- No candle closes above the second candle's high and price drifts sideways just above the lows. The setup never triggered; treat it as a stalled decline, not a buy.
- Both candles close near their lows. Equal lows with weak closes can be coincidence, and sellers are still finishing each session in control.
Often confused with
Tweezer Bottom vs Bullish Engulfing: what's the difference?
A bullish engulfing is judged on bodies: the green body must cover the prior red body. A tweezer bottom is judged on lows, and the second body may be small. When the green candle both matches the low and engulfs the red body, the two signals reinforce each other.
Tweezer Bottom vs Double Bottom: what's the difference?
Both rest on two equal lows, but a double bottom separates them with a rally of many bars and confirms on a break above that rally's peak. A tweezer bottom's lows are on adjacent candles, and its trigger is the second candle's high.
Tweezer Bottom vs Piercing Line: what's the difference?
A classic piercing line has the green candle open below the red candle's low, so its own low sits beneath the first one, and close past the red body's midpoint. A tweezer bottom ignores the open and requires the two lows to line up instead.
Tweezer Bottom vs Tweezer Top: what's the difference?
The mirror image. A tweezer top lines up two highs after a rally and points down; a tweezer bottom lines up two lows after a decline and points up. Check which end of the candles matches and which way price was travelling.
How reliable is the tweezer bottom pattern?
Nison treats tweezers as minor reversal signals whose importance rises when the second candle is a bullish pattern in its own right, such as a hammer or an engulfing line, or when the matching lows fall on established support. Hence the context-dependent tier: two neighbouring candles sharing a low is an ordinary event, and inside a sideways market it tells you nothing. The pair becomes informative only after a genuine decline, at a level that mattered before, and once a later close clears the second candle's high. Bulkowski catalogues tweezers too, and how a tweezer bottom appears to perform shifts with how strictly the lows must match, how the prior downtrend is defined and whether a confirmation close is required, so no single number describes it.
References
- Steve Nison. Japanese Candlestick Charting Techniques . Prentice Hall Press , 2001 . ISBN 978-0735201811.
- Thomas N. Bulkowski. Encyclopedia of Candlestick Charts . Wiley , 2008 . ISBN 978-0470182017.
Frequently asked questions
What does a tweezer bottom mean?
Is a tweezer bottom bullish or bearish?
How do you trade a tweezer bottom?
Does a tweezer bottom need confirmation?
What happens after a tweezer bottom?
Practise spotting the tweezer bottom
Reading about a pattern is not the same as recognising it under time pressure. Chart Guess drills 53 patterns as a 60-second game — read the chart, call BUY or SELL, get the pattern name instantly.