Dragonfly Doji Candlestick Pattern
A dragonfly doji is a single T-shaped candlestick whose open, high and close sit at virtually the same price above a long lower wick: sellers drove price well down during the session, buyers bought it all back by the close, and after a decline it marks a possible bullish reversal.
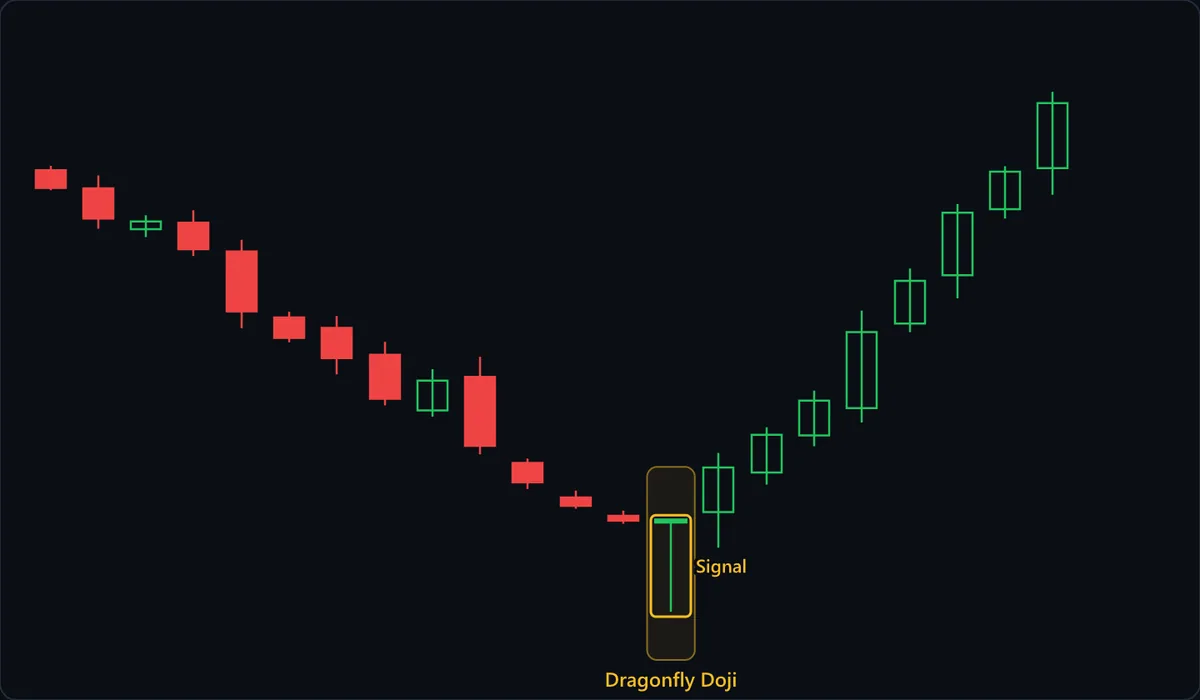
Chart data
| # | Open | High | Low | Close |
|---|---|---|---|---|
| 1 | 106.98 | 107.15 | 106.21 | 106.3 |
| 2 | 106.28 | 106.78 | 104.73 | 105.12 |
| 3 | 104.71 | 105.25 | 104.41 | 105.01 |
| 4 | 104.96 | 105.44 | 103.68 | 103.94 |
| 5 | 103.85 | 104.3 | 100.9 | 101.55 |
| 6 | 101.31 | 101.54 | 100.36 | 100.53 |
| 7 | 100.91 | 101.37 | 99.13 | 99.75 |
| 8 | 99.88 | 100.38 | 97.93 | 98.19 |
| 9 | 97.74 | 99.33 | 97.5 | 98.89 |
| 10 | 99.03 | 99.8 | 96.05 | 96.38 |
| 11 | 95.72 | 95.89 | 94.72 | 94.98 |
| 12 | 94.39 | 94.66 | 93.96 | 94.07 |
| 13 | 93.69 | 93.89 | 93.38 | 93.5 |
| 14 | 93.5 | 93.52 | 90 | 93.52 |
| 15 | 93.83 | 96.11 | 92.46 | 95.55 |
| 16 | 95.35 | 97.09 | 94.89 | 96.8 |
| 17 | 96.78 | 98.5 | 96.36 | 98.12 |
| 18 | 97.83 | 101.58 | 97.28 | 100.75 |
| 19 | 101.08 | 103.2 | 100.75 | 102.72 |
| 20 | 102.94 | 105.68 | 102.05 | 105.34 |
| 21 | 105.48 | 107.13 | 105.12 | 106.92 |
| 22 | 107.06 | 110 | 106.03 | 109.56 |
At a glance
| Type | Bullish reversal |
|---|---|
| Direction | Bullish |
| Bars required | 1 candle |
| Family | Candlestick pattern |
| Evidence | Context dependent |
| Also called | dragonfly doji candlestick, dragonfly doji pattern, dragonfly candle |
What timeframe does it work on?
The shape is strict, since three prices must coincide, so true dragonflies are uncommon on daily and weekly charts, while on one-minute charts a quiet bar with one spike low can qualify and mean little. In round-the-clock markets such as forex and crypto, the daily open depends on your data feed's session cutoff, so one day can print a dragonfly on one platform and a hammer on another.
Anatomy of the pattern
- Open, high and close as one — The flat top defines it: open, high and close within a hair of one price, here 93.50, 93.52 and 93.52 on a 3.52-point candle. The missing upper wick matters as much as the missing body; add a real upper wick above the open and it is no longer a dragonfly but an ordinary doji, or a long-legged doji if that upper wick is long too.
- The long lower wick — The wick is the sell-off itself, the full distance sellers pushed below the open before buyers took it back. Judge it against its neighbors: this one runs 3.5 points down to the round 90.00, while none of the three shrinking candles before it spanned more than 1.2.
- Back to the open, not beyond — A green hammer shows buyers finishing above the open; a dragonfly shows them recovering only to it and stopping. The candle proves the low was rejected, not that buyers can lift price, which is why the next candle carries so much weight.
- Signal, then trigger — The chart labels the dragonfly as the signal. The trigger is the next candle, which dips to 92.46, back inside the wick, yet closes at 95.55, above the 93.52 high: confirmation can still revisit the wick.
How to identify it
- Open and close are so close that the body draws as a line, not a box.
- The high is at or within a hair of the open and close; any upper wick is a barely visible stub.
- The lower wick is most of the candle and long next to the ranges of the last several candles.
- Price was falling into the candle, or dropping into support, rather than drifting sideways.
- The low tags a level that mattered: prior support, an earlier swing low, a round number, or just under the recent lows.
How to trade it
Entry. The standard entry is the close of the next candle, if it finishes above the dragonfly's high. The dragonfly shows buyers erasing the sell-off but stopping at the open; a close above its high is the first sign they can push into prices that session never reached. That proof costs entry price: here the confirming close, 95.55, sits about 2 points above the 93.52 high.
Stop. Below the dragonfly's low, 90.00 here: the deepest point sellers reached and could not hold, so a close beneath it means the rejection failed. A stop under the body sits inside the wick buyers just defended, where the confirming candle itself traded. A long wick means a wide stop, so shrink the position, not the stop.
Target. The candle implies no distance, so aim at the nearest resistance and trade only if it sits at least twice the risk away. The wide stop makes that strict: a 95.55 entry with a stop under 90.00 risks about 5.6 points, yet even the rebound high near 99.8 at candle 10, well beyond the 95.89 high of candle 11 just overhead, is less than one risk unit away, so the rule skips the setup drawn above even though price went on to rally.
What invalidates it
- A close below the dragonfly's low: the level buyers defended has been taken, and the candle's message is void.
- It formed after a rally, where the same shape shows sellers knocking price sharply lower: a hanging-man-style warning, not a buy.
- The trigger never comes: no later candle closes above the high, so buyers never followed through.
- The wick is short next to recent candles, so it records a small dip on a quiet bar, not a sell-off being absorbed.
- The low ends in empty space, far from support, a prior swing low or a round number, so there was no level for buyers to defend.
Often confused with
Dragonfly Doji vs Gravestone Doji: what's the difference?
A gravestone is the dragonfly flipped: open, low and close at the bottom under a long upper wick, recording a rally sellers fully reversed. The dragonfly leans bullish after declines, the gravestone bearish after advances; check which way the wick points first.
Dragonfly Doji vs Hammer: what's the difference?
Both have a long lower wick, but a hammer keeps a small visible body while a dragonfly's open and close are effectively one price. See a real box sitting on top of a wick at least twice its height, after a decline, and it is a hammer; the same box after an advance is a hanging man.
Dragonfly Doji vs Hanging Man: what's the difference?
A hanging man has a small visible body and by definition follows an advance. A dragonfly after an advance is read the same way, as a bearish warning: location sets the meaning of both, and the body only sets the name.
How reliable is the dragonfly doji pattern?
The dragonfly is rated context dependent because the same candle reads as bullish after a decline and as a warning after an advance, so a result means nothing until you say where it formed. The classic candlestick literature presents it as a rejection of lower prices that matters most at the end of a sell-off and at support. Published results are hard to compare. The strict shape is uncommon, and each study must choose how much body and upper wick still counts; loosen that and you are partly testing hammers. What the candle reliably gives you is a defined risk point at the low of the wick. The chart above shows the textbook follow-through; the next dragonfly may close back under its low instead.
References
- Steve Nison. Japanese Candlestick Charting Techniques . Prentice Hall Press , 2001 . ISBN 978-0735201811.
- Thomas N. Bulkowski. Encyclopedia of Candlestick Charts . Wiley , 2008 . ISBN 978-0470182017.
Frequently asked questions
What does a dragonfly doji mean?
Is a dragonfly doji bullish or bearish?
How do you trade a dragonfly doji?
Is a red dragonfly doji bearish?
How reliable is the dragonfly doji?
Practise spotting the dragonfly doji
Reading about a pattern is not the same as recognising it under time pressure. Chart Guess drills 53 patterns as a 60-second game — read the chart, call BUY or SELL, get the pattern name instantly.