Bullish Engulfing Pattern
A bullish engulfing pattern is a two-candle formation in which a small down candle is followed by a larger up candle whose body completely engulfs the first, signalling that buyers have taken control after a decline.
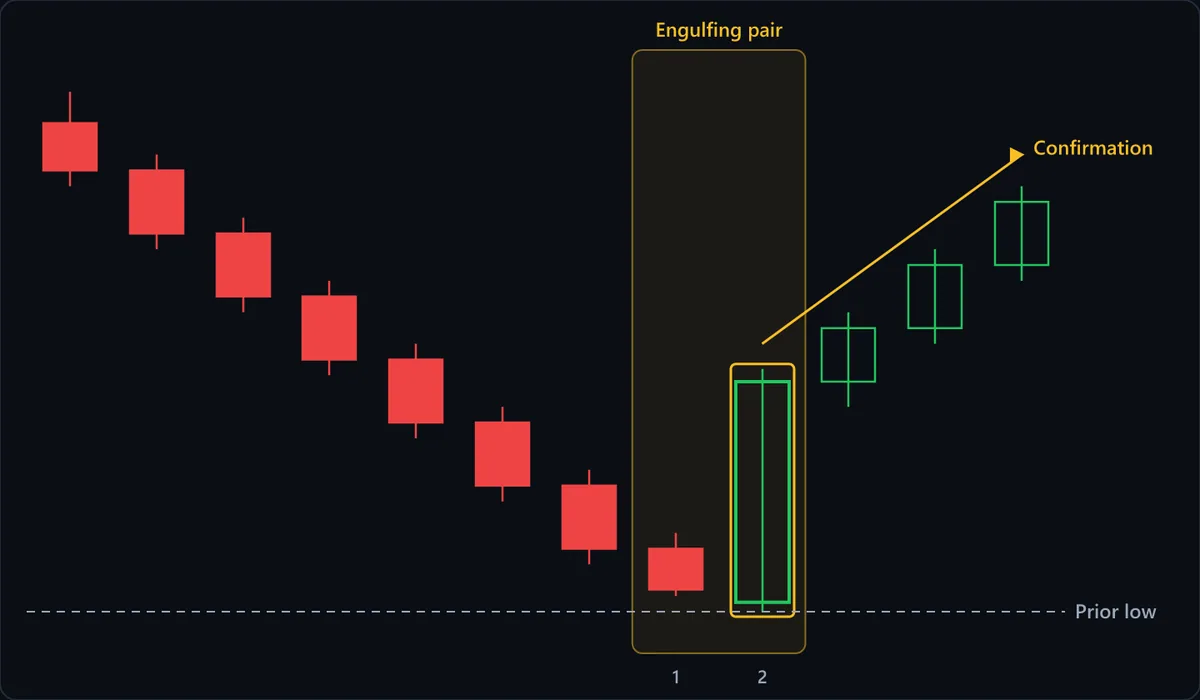
Chart data
| # | Open | High | Low | Close |
|---|---|---|---|---|
| 1 | 112 | 113 | 110 | 110.5 |
| 2 | 110.5 | 111 | 108 | 108.5 |
| 3 | 108.5 | 109 | 106 | 106.5 |
| 4 | 106.5 | 107 | 104 | 104.5 |
| 5 | 104.5 | 105 | 102 | 102.5 |
| 6 | 102.5 | 103 | 100 | 100.5 |
| 7 | 100.5 | 101 | 98 | 98.5 |
| 8 | 98.5 | 99 | 97 | 97.2 |
| 9 | 96.8 | 104.2 | 96.5 | 103.8 |
| 10 | 103.8 | 106 | 103 | 105.5 |
| 11 | 105.5 | 108 | 105 | 107.5 |
| 12 | 107.5 | 110 | 107 | 109.5 |
At a glance
| Type | Bullish reversal |
|---|---|
| Direction | Bullish |
| Bars required | 2 candles |
| Family | Candlestick pattern |
| Evidence | Moderate |
| Also called | engulfing candle, bullish engulfing candle, bullish outside bar |
What timeframe does it work on?
It appears on every timeframe, but the signal means far more on daily and higher charts than on 1- or 5-minute charts, where a single large order can produce the shape without any real shift in sentiment. Intraday, treat it as a timing cue inside a trend you identified elsewhere rather than as a reversal signal in its own right.
Anatomy of the pattern
- Prior downtrend — The pattern only means anything after a decline. Without a run of lower highs and lower lows into it, a large green candle following a small red one is ordinary two-bar noise — there is no established seller control for buyers to seize.
- Candle 1 — the small down candle — A modest red body continuing the existing decline. The small body is what makes the setup readable: it shows selling losing momentum rather than accelerating.
- Candle 2 — the engulfing candle — A green candle that opens at or below candle 1's close and closes at or above candle 1's open, so its body fully covers candle 1's body. The classical definition concerns the bodies, not the wicks — many textbook examples have candle 1's wicks poking outside candle 2's range.
- Relative size — The more decisively candle 2 dwarfs candle 1, the stronger the implied shift. A green body only fractionally larger than the red one is a marginal case and behaves like one.
How to identify it
- Price has been declining into the pattern, not ranging sideways.
- Candle 1 is a down candle (close below open) with a relatively small body.
- Candle 2 is an up candle (close above open) that opens at or below candle 1's close.
- Candle 2 closes at or above candle 1's open, so candle 1's body sits entirely inside candle 2's body.
- Ideally it forms at a level that already mattered — a prior swing low, a support zone, or a moving average people watch.
How to trade it
Entry. The conservative entry is a break above candle 2's high on the following candle, which asks the market to confirm rather than asking you to predict. The aggressive entry is at candle 2's close, which gets a better price but takes every failed pattern at full size. Waiting for confirmation costs part of the move and removes a large share of the false signals.
Stop. Below the low of the two-candle pattern, usually candle 2's low since it is the deeper of the two. Placing it just under candle 1's low gives a tighter stop but sits inside the noise the pattern itself created. If the correct stop is further away than your risk allows, the answer is a smaller position, not a closer stop.
Target. Common choices are the nearest overhead resistance, the prior swing high, or a fixed multiple of the risk taken. The pattern implies no particular distance — it says something about who is in control now, not about how far price will travel, so the target has to come from the surrounding structure.
What invalidates it
- It formed inside a range rather than after a decline. This is the most common error by a wide margin: the shape is present but there is no downtrend for it to reverse, so it carries no information.
- Price closes back below candle 2's low. The premise — that buyers absorbed the selling — is simply false at that point.
- The engulfing candle is enormous relative to recent bars and lands on a scheduled news release. The size reflects the event, not a change in the balance between buyers and sellers.
- You matched the wicks instead of the bodies. A candle whose full high-low range covers the previous bar but whose body does not is an outside bar — related, but a weaker and different observation.
- It appears on a very low timeframe or in a thinly traded instrument, where a single participant can manufacture the shape.
Often confused with
Bullish Engulfing vs Bullish Kicker: what's the difference?
A bullish engulfing's second candle opens at or below the red candle's close and its body covers the red body. A kicker's second candle opens above the red candle's open, so the bodies never overlap. If you can see the green body wrapping the red one, it is engulfing.
Bullish Engulfing vs Doji: what's the difference?
A doji has almost no body and signals indecision, not control. An engulfing pattern's second candle has a decisively large body. The two are near opposites in what they say about conviction.
Bullish Engulfing vs Hammer: what's the difference?
A hammer is a single candle with a long lower wick and a small body near the top. A bullish engulfing needs two candles and is defined by the second body covering the first. If you can see the whole signal in one bar, it is not an engulfing.
Bullish Engulfing vs Piercing Line: what's the difference?
Look at where the green candle closes relative to the red candle's open. Below the open but above the midpoint is a piercing line; at or above the open, so the green body covers the entire red body, is a bullish engulfing.
Bullish Engulfing vs Three Outside Up: what's the difference?
Candles 1 and 2 of a three outside up are a bullish engulfing, so the third candle is the whole difference. An engulfing is complete at its second candle and still awaits confirmation; a three outside up exists only once a third green candle closes above the engulfing candle's close.
Bullish Engulfing vs Tweezer Bottom: what's the difference?
A bullish engulfing is judged on bodies: the green body must cover the prior red body. A tweezer bottom is judged on lows, and the second body may be small. When the green candle both matches the low and engulfs the red body, the two signals reinforce each other.
How reliable is the bullish engulfing pattern?
Engulfing patterns are among the more consistently studied candlestick formations, and they appear in the standard references as genuine reversal signals rather than folklore. But published figures vary widely, and the reason matters: results depend heavily on how strictly the pattern is defined, whether confirmation on the following candle is required, what counts as a prior downtrend, and which market and period were sampled. A study requiring a confirmed close above the pattern will report very different numbers from one entering at candle 2's close. Treat any single quoted percentage with suspicion, including a flattering one. The defensible summary: a modest edge when the pattern forms after a real decline at a level that already mattered, and close to none when it does not.
References
- Thomas N. Bulkowski. Encyclopedia of Candlestick Charts . Wiley , 2008 . ISBN 978-0470182017.
- Steve Nison. Japanese Candlestick Charting Techniques . Prentice Hall Press , 2001 . ISBN 978-0735201811.
Frequently asked questions
Is a bullish engulfing pattern always bullish?
Do the wicks have to be engulfed too?
How reliable is the bullish engulfing pattern?
What is the difference between a bullish and a bearish engulfing pattern?
Practise spotting the bullish engulfing
Reading about a pattern is not the same as recognising it under time pressure. Chart Guess drills 53 patterns as a 60-second game — read the chart, call BUY or SELL, get the pattern name instantly.